# Overview

Pentest Copilot Enterprise - AI-native autonomous red-teaming

Pentest Copilot Enterprise helps security teams run repeatable external and internal security assessments from one control plane. The platform combines target scoping, agent-based execution, browser automation, exploit-graph analysis, validated findings, retesting, scheduling, reporting, and API/MCP automation.

<figure><img src="/files/aBhxDiWdefswIZWal0bF" alt=""><figcaption></figcaption></figure>

## What Pentest Copilot Runs

| Assessment type           | What it covers                                                                                                                                | Typical operator input                                                                                                              |
| ------------------------- | --------------------------------------------------------------------------------------------------------------------------------------------- | ----------------------------------------------------------------------------------------------------------------------------------- |
| **External Discovery**    | Domains, subdomains, web pages, APIs, services, exposed cloud objects, and other internet-facing assets.                                      | Root domain, optional discovery depth, optional authenticated browser sessions.                                                     |
| **External Assessment**   | Contextual web and API vulnerability testing, authenticated and unauthenticated user flows, attack-path construction, and finding validation. | Target domains, authentication mode, browser sessions, attack vectors, rate limits, trajectory scope, and browser controls.         |
| **Code Assessment**       | Source-code vulnerability review, open-source dependency risk, leaked secrets, business logic and authorization review, SBOM, and AI-BOM.     | GitHub App connection, repository selection, branch or commit, scan checks, automation triggers, branch filters, and auto-fix mode. |
| **Internal Discovery**    | Internal hosts and services reachable from a deployed agent.                                                                                  | Connected local agent and authorized subnet/CIDR scope.                                                                             |
| **Internal Assessment**   | Active Directory, host, credential, delegation, ADCS, lateral movement, and selected exploit validation paths.                                | Subnets, agent assignment, allowed exploit families, exclusions, PCE Intercept/Inveigh settings, and RCE safety controls.           |
| **Credential Compromise** | Credential collection and attack-path workflows for tenants with the credential-compromise module enabled.                                    | Module-specific inputs and approved scope.                                                                                          |

## Product Layout

The left sidebar is the main navigation. Enterprise onboarding uses these areas:

| Section       | Purpose                                                                                                                                                                             |
| ------------- | ----------------------------------------------------------------------------------------------------------------------------------------------------------------------------------- |
| **Dashboard** | Guided six-phase launch path, mission status, exploit graph, target entities, agents, and MITRE ATT\&CK mapping.                                                                    |
| **Modules**   | Configure and run discovery, assessment, code assessment, credential-compromise, custom, and retest workflows.                                                                      |
| **Activity**  | Track running and historical modules, submodules, logs, and schedules.                                                                                                              |
| **Reports**   | Generate executive and comprehensive PDF reports.                                                                                                                                   |
| **Settings**  | Configure usage, account/team, domains, domain verification, external assessment defaults, agents, API keys and MCP, integrations, email identities, debug tools, and trajectories. |

## Recommended First Enterprise Run

1. Sign in to the deployment and confirm your user role has access to scans, reports, settings, and API keys as needed.
2. Open **Settings -> Domains** and add the approved root domains.
3. Verify domain ownership from **Settings -> Domain Verification** when required.
4. Confirm at least one execution worker is available:
   * external scans need a SANDBOX runner, either managed for your deployment or attached to your environment;
   * internal scans need a local AGENT that can route to the target subnet.
5. Record browser sessions for each important authenticated role.
6. Run **External Discovery Phase** before an external attack phase unless the target surface is already mapped.
7. Review discovery output, then run **External Attack Phase** with the needed authentication modes, attack vectors, rate limits, and trajectory scope.
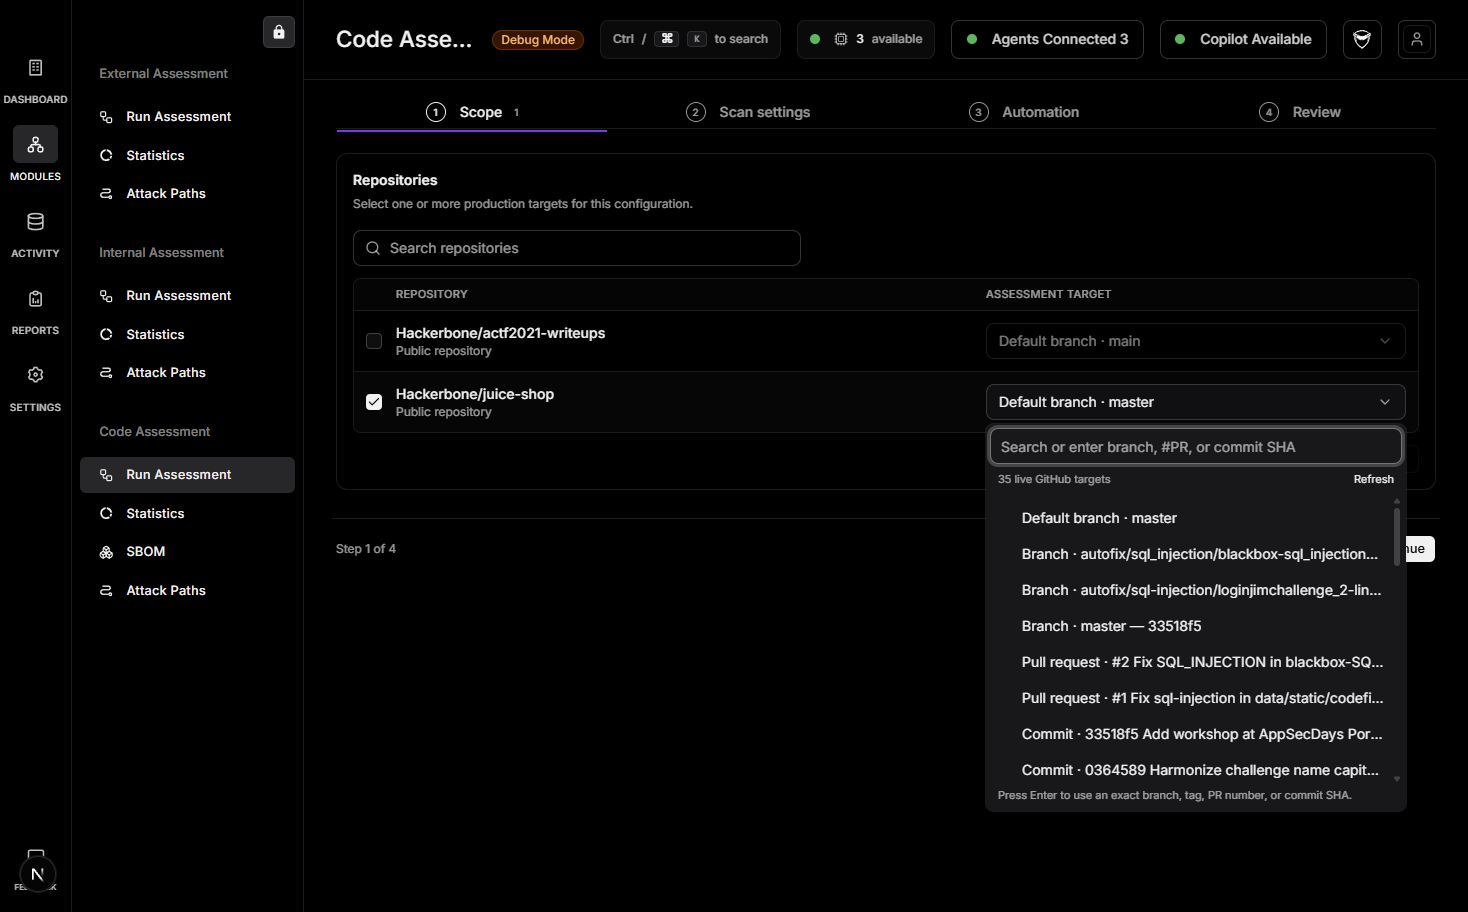
8. For source-code review, connect the GitHub App, select repositories from **Modules -> Code Assessment**, and run the default branch or a specific branch/commit.
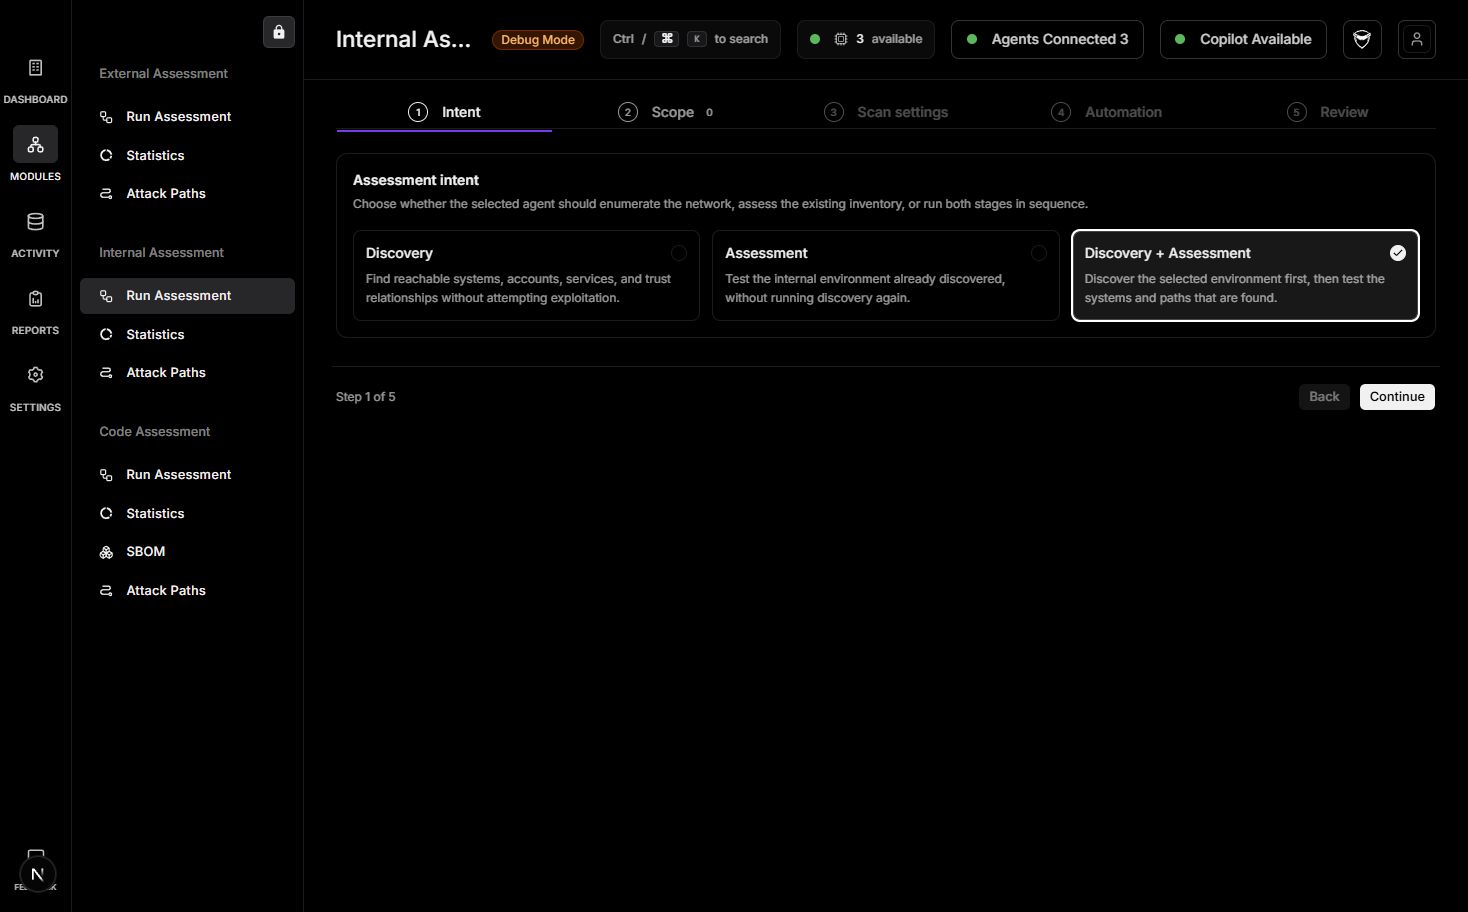
9. For internal testing, run internal discovery first, then use the internal attack phase page to select subnets, agents, allowed exploits, and exclusions.
10. Monitor **Activity**, triage **Attack Paths**, review SBOM/AI-BOM exports where applicable, and generate a report from **Reports**.

{% hint style="warning" %}
Pentest Copilot enforces scan launch policy. API keys, MCP clients, and UI actions cannot bypass permissions, feature access, usage/credit state, scope controls, or agent availability.
{% endhint %}

## Important Safety Concepts

* **Whitelist and blacklist rules** keep external testing inside approved domain and trajectory scope.
* **Rate limits** and auto-calibration help avoid overwhelming fragile targets or triggering rate limits.
* **Browser-session readiness** prevents authenticated scans from starting with expired or incomplete login state.
* **Code Assessment branch selection** makes clear whether the run uses the default branch, a selected branch/commit, a pull request head branch, or a push branch filter.
* **SBOM and AI-BOM exports** help teams review software dependencies and AI/LLM usage in source repositories.
* **Internal exploit selection** is explicit per subnet. Some categories can change AD, ADCS, host, credential, or ticket state.
* **PCE Intercept/Inveigh** is opt-in per subnet and binds only to selected agent interfaces.
* **Max module runtime** can cancel remaining submodules when a configured runtime limit is reached.

{% content-ref url="/pages/m0MFk64j3GzxywJZ70vv" %}
[Scan Noise and Safety](/enterprise/scan-noise-and-safety)
{% endcontent-ref %}

Please contact <queries@bugbase.ai> for onboarding, deployment, or engagement-specific questions.


# Enterprise Onboarding Checklist

A practical checklist for preparing a first enterprise scan.

Use this checklist before your first enterprise scan. It is written for operators who will configure and run scans, and for security stakeholders who need to approve scope.

## Access and Tenant Setup

* Sign in to the deployment URL through your configured identity provider.
* Confirm the initial users have the correct roles for scans, reports, settings, API keys, and user management.
* Confirm who owns scan approvals, agent installation, and cleanup.

<figure><img src="/files/pyfNuw9bIDzz9zEETe9s" alt=""><figcaption></figcaption></figure>

## External Assessment Prerequisites

* Collect approved root domains and any explicitly excluded third-party domains.
* Add root domains in **Settings -> Domains** or from the New Assessment flow.
* Verify root-domain ownership in **Settings -> Domain Verification** when required by your deployment.
* Confirm your team understands that subdomains are discovered automatically from the root domain.
* Decide whether target WAF/CDN/firewall rules should allowlist the scanner IPs, use residential browser traffic, or both.
* Record browser sessions for each role that should be tested, such as admin, manager, regular user, read-only user, or support user.
* Validate browser sessions before running authenticated scans.
* Define rate limits for fragile, rate-limited, or production-sensitive targets.
* Define domain and trajectory deny rules before scanning sensitive paths.

## Internal Assessment Prerequisites

* Identify the network segment where the local agent will run.
* Confirm the agent host can reach the approved subnets and required services.
* Confirm endpoint protection, EDR, firewall, and proxy expectations for the agent host.
* Confirm which exploit families are authorized, especially AD write operations, ADCS abuse, RCE, credential dumping, relay, and data-copy paths.
* Confirm cleanup ownership for AD/ADCS changes, host implants, service changes, credential rotation, and copied files.
* Decide whether PCE Intercept/Inveigh may be enabled, and which interfaces it may bind to.
* Run internal discovery before internal assessment so subnets, hosts, services, users, and groups are visible.

{% content-ref url="/pages/Wo8uaAQGOpoDSX3mEaRZ" %}
[Internal Assessment Destructive Actions](/enterprise/how-to-trigger-an-internal-scan/internal-assessment-destructive-actions)
{% endcontent-ref %}

## First Scan Plan

For the first run, start narrow:

1. Run external discovery on one root domain.
2. Review discovered pages, APIs, trajectories, and services.
3. Record and validate one low-risk authenticated browser session.
4. Run an external assessment with a conservative rate limit and only the approved attack vectors.
5. Review **Activity** and **Attack Paths** with your security stakeholders.
6. Generate an executive report and a comprehensive report.
7. Expand scope only after your team is comfortable with volume, traffic shape, and results.

For internal assessment, start with one subnet and a small exploit set. Add destructive categories only after your team signs off on impact and cleanup.


# Scan Noise and Safety

Understand scan traffic, loudness, safety controls, and operational edge cases.

Pentest Copilot can run quiet discovery, browser-based crawling, contextual web/API testing, and active internal exploitation. The right configuration depends on your engagement rules, production sensitivity, target defenses, and appetite for proof-of-impact.

## Noise Levels

| Activity                          | Typical noise                            | Notes                                                                                                                                                         |
| --------------------------------- | ---------------------------------------- | ------------------------------------------------------------------------------------------------------------------------------------------------------------- |
| External domain discovery         | Low to medium                            | DNS, certificate, search, and service enumeration. Volume depends on domain size.                                                                             |
| External web crawling             | Medium                                   | Sends browser and HTTP requests to discovered pages and APIs. Use rate limits for fragile targets.                                                            |
| External authenticated assessment | Medium to high                           | Replays logged-in sessions and tests application-specific flows. Multiple roles increase traffic.                                                             |
| External attack vectors           | Medium to high                           | Injection, authorization, upload, SSRF, XSS, business-logic, and related tests may trigger WAF/EDR/app alerts.                                                |
| Manual crawler                    | Operator-controlled                      | Traffic is generated by the operator's manual navigation through a proxied browser.                                                                           |
| Internal discovery                | Medium                                   | Scans reachable hosts/services from the selected agent. May be visible to NDR/EDR.                                                                            |
| Internal assessment               | High when exploit categories are enabled | Can authenticate, attempt lateral movement, run commands, relay NTLM, copy files, deploy callbacks, or change AD/ADCS state depending on selected categories. |

## External Safety Controls

* **Domain whitelist:** Approved domains that may be tested.
* **Domain blacklist:** Domains that must not be tested. Blacklist wins over whitelist.
* **Trajectory scope:** Per-host path rules and per-run trajectory selection restrict which APIs/user flows are tested.
* **Authentication mode:** Choose unauthenticated, authenticated, or both. Authenticated mode requires browser sessions.
* **Browser-session readiness:** The scanner warns when selected sessions lack usable login state or validation data.
* **Rate limit:** Caps request volume for the target.
* **Auto-calibration:** Sends probe traffic to estimate a sustainable rate. This can send up to 400 requests in short bursts.
* **Residential browser IP:** Routes browser traffic through a residential proxy when bot defenses block datacenter traffic.
* **Custom headers:** Adds required test headers, API keys, tenant selectors, or WAF bypass headers where approved.
* **Max module runtime:** Cancels remaining work if the configured runtime limit is reached.

## Internal Safety Controls

* **Agent placement:** Internal scans run from your network through a connected agent.
* **Subnet selection:** Operators select specific subnets before running internal assessment.
* **Agent assignment:** Each selected subnet has an assigned agent. Agents in the same subnet are prioritized.
* **Entity exclusion:** Hosts, users, groups, and services can be excluded from a selected subnet.
* **Allowed exploits:** Exploit families are enabled or disabled per subnet.
* **Destructive-action warnings:** High-impact categories are highlighted in the final review.
* **PCE Intercept/Inveigh:** NTLM capture/relay is opt-in and requires selected network interfaces.
* **RCE skip controls:** Operators can skip RCE when the graph already marks the host or user as compromised.

## When to Slow Down

Use conservative settings when:

* the target is production and has strict SLOs;
* the application has aggressive WAF, bot, or rate-limiting controls;
* login sessions expire quickly or allow only one active session;
* user flows trigger emails, payments, state transitions, or external integrations;
* internal testing touches domain controllers, ADCS, privileged groups, production databases, or file shares;
* your team wants discovery-only evidence before active exploitation.

## Edge Cases to Plan For

* **Bot detection during recording:** Enable residential browser traffic or allowlist SANDBOX IPs.
* **Single-session applications:** Enable browser isolation options when multiple tabs or shared state cause forced logout.
* **Expired browser sessions:** Re-record or validate sessions before running authenticated scans.
* **Manual crawler windows:** Keep the proxied browser open until trajectories are saved. Cancel the crawler from the UI if needed.
* **Internal route mismatch:** If no hosts appear after internal discovery, verify the agent's route to the subnet and local firewall rules.
* **Responder interface mismatch:** PCE Intercept/Inveigh cannot start until at least one valid interface is selected for the chosen agent.
* **Scheduled scans:** Schedules reuse saved scan configuration. Review saved configs when scope, sessions, or agent availability changes.


# How to Trigger an External Scan

Follow these steps to start a new external scan in Pentest Copilot Enterprise.

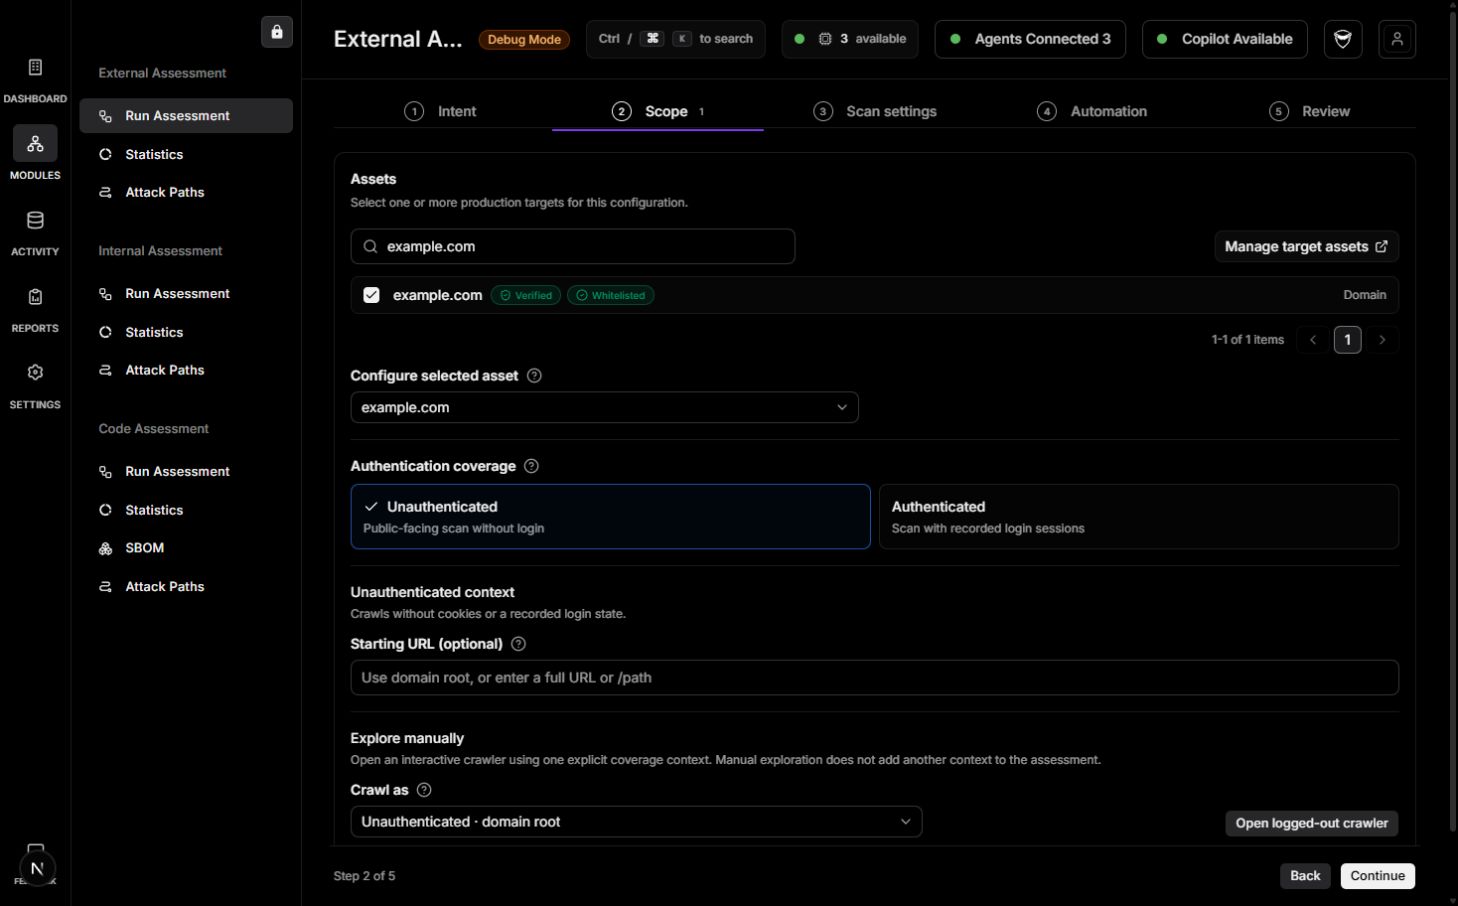
External scanning is normally launched from the guided **New Assessment** flow, then configured in **Modules -> External Assessment**. The guided flow helps new users complete the required steps in order; the module pages expose the full scan configuration.

{% hint style="info" %}
**Video walkthrough:** [Configure an external assessment](https://www.youtube.com/watch?v=O5AbZoO-uP4)
{% endhint %}

<figure><img src="/files/aBhxDiWdefswIZWal0bF" alt=""><figcaption></figcaption></figure>

## External Scan Flow

1. Add a root domain.
2. Confirm a SANDBOX runner is available.
3. Run external discovery.
4. Run external assessment.
5. Review attack paths and generate reports.

## 1. Add the Root Domain

From **New Assessment**, select **External** and enter the approved root domain, for example `example.com`.

Enter only the domain name. Do not include `https://`, a path, or query parameters. Subdomains and paths are discovered later.

You can also add domains from **Settings -> Domains** or **Dashboard -> Target Entities**.

## 2. Confirm SANDBOX Capacity

External discovery and browser-based testing require a SANDBOX runner. Your deployment can use managed SANDBOX capacity or infrastructure attached to your environment, depending on how it was deployed.

Check **Dashboard -> Agents** or **Settings -> Agent** to confirm the SANDBOX runner is connected before a scan.

## 3. Run External Discovery

Open **Modules -> External Assessment -> Discovery Phase**.

1. Select one or more target domains.
2. Open the target settings drawer if you need authenticated sessions, custom headers, discovery type, rate limits, or browser options.
3. Choose the discovery type:
   * **Run Full Discovery** crawls reachable pages and APIs and can feed the attack phase.
   * **Discover Domains only** maps the domain surface without deep crawling.
4. Optionally enable **Trigger Attack Phase automatically after discovery**. This forces full discovery and starts the external assessment when discovery finishes.
5. Save the target configuration.
6. Click **Run Assessment** to open the final configuration review.
7. Review duration and credit estimates, saved config status, authentication readiness, target scope, and settings.
8. Click **Run assessment** to start the run.

<figure><img src="/files/uQETBqzYHrAdcpOiMO3k" alt=""><figcaption></figcaption></figure>

## 4. Run External Assessment

Open **Modules -> External Assessment -> Attack Phase**.

1. Select one or more target domains.
2. Open the settings drawer for each target or apply settings to selected targets.
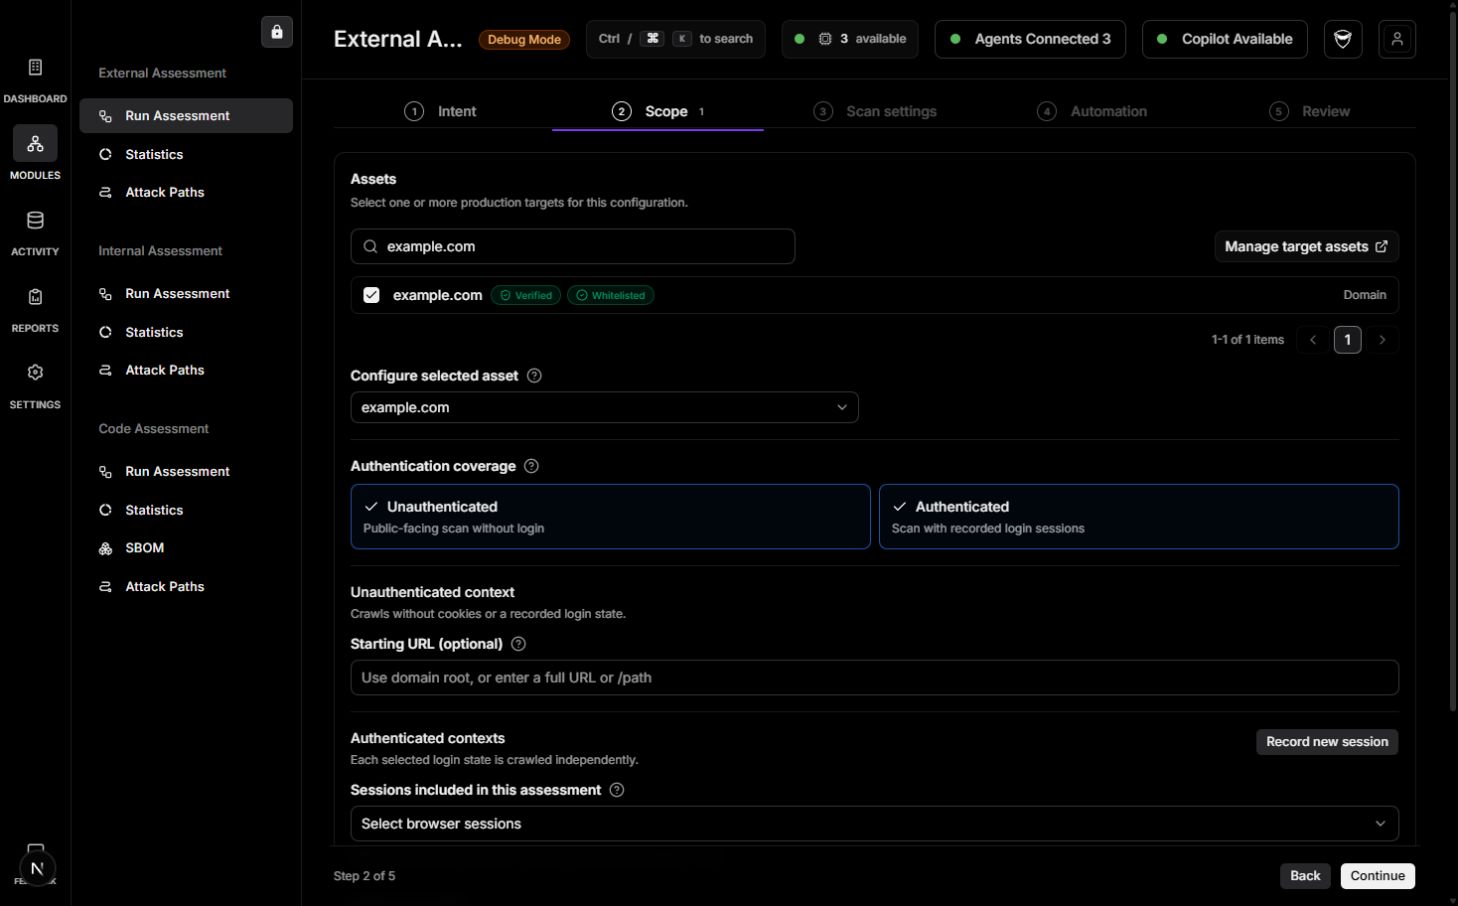
3. Choose authentication mode:
   * **Unauthenticated** for public pages and APIs.
   * **Authenticated** to reuse one or more browser sessions.
   * Both modes if public and logged-in surfaces should be tested.
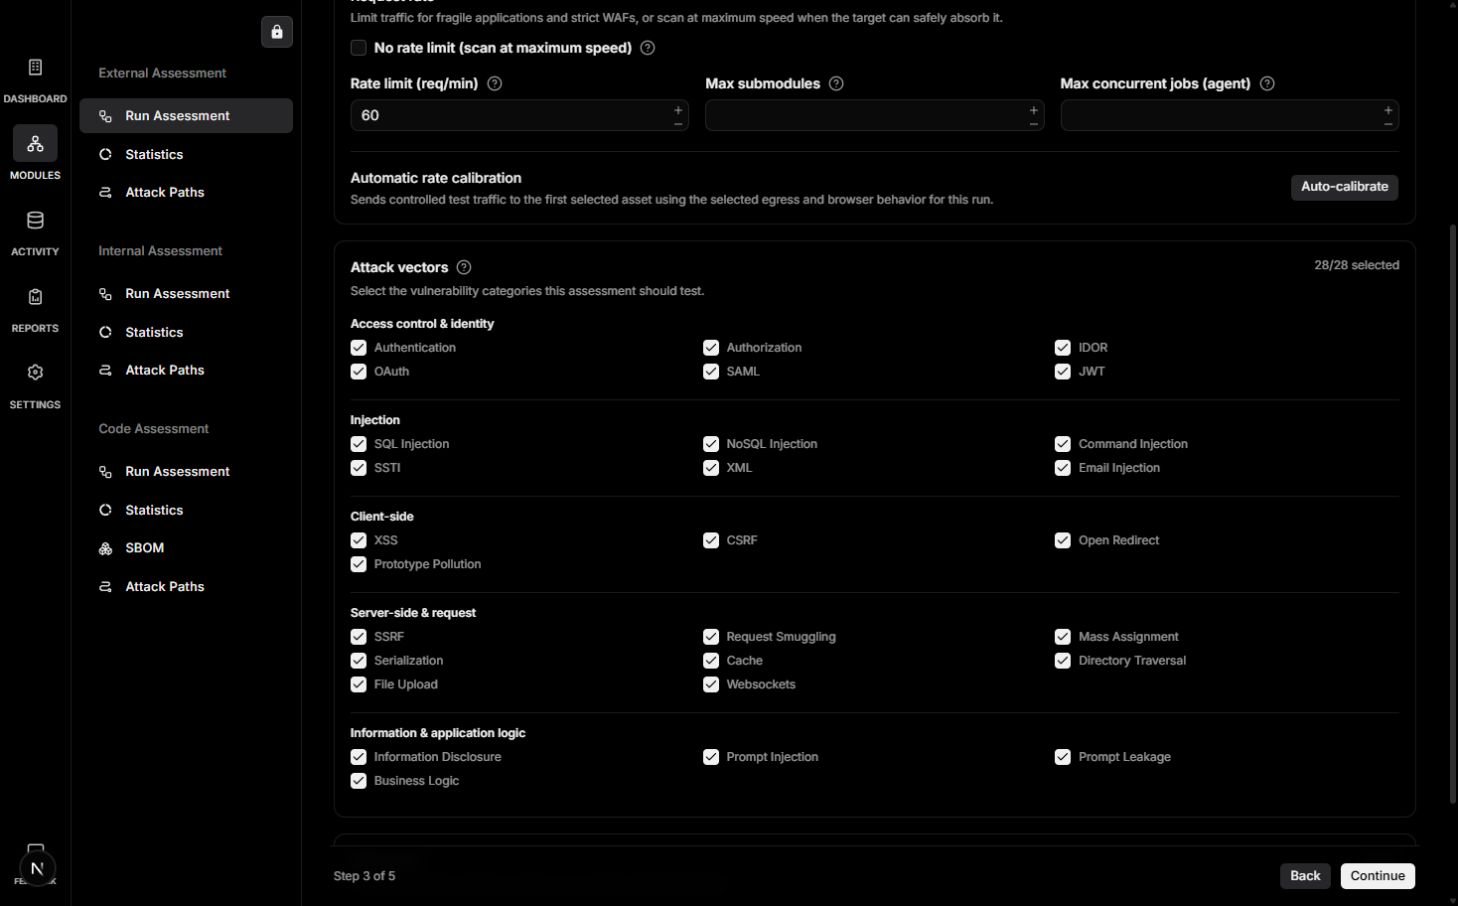
4. Choose attack vectors. Leaving all vectors unselected is treated as broad coverage.
5. Set rate limits, custom headers, trajectory scope, and browser options as required.
6. Save configuration for selected assets.
7. Review estimates and warnings.
8. Click **Run assessment**.

{% content-ref url="/pages/JqTFyGv6qHEq1MBlbEzs" %}
[Configure Scan Settings for External Assessment](/enterprise/how-to-trigger-an-external-scan/configure-scan-settings-for-external-assessment)
{% endcontent-ref %}

## 5. Monitor the Run

Open **Activity -> Activity** to follow module and submodule status. The Activity detail page shows the module timeline and can be used to understand which stages are pending, running, completed, failed, cancelled, or scheduled.

{% content-ref url="/pages/QJ9ahgjtOWQNnN87Ivzs" %}
[Activity](/enterprise/activity)
{% endcontent-ref %}

## 6. Review Results

After assessment completes:

* Open **Modules -> External Assessment -> Statistics** for aggregate severity and category views.
* Open **Modules -> External Assessment -> Attack Paths** for validated findings.
* Open a finding detail page to review evidence, AI reasoning, remediation, status, retest controls, and the graph drawer.
* Generate reports from **Reports**.

{% content-ref url="/pages/yIa5DS9u5uSEnjRhi5DZ" %}
[Analysing Scan Results](/enterprise/analysing-scan-results)
{% endcontent-ref %}

## Common Blocks

| Block                                | What to check                                                                                                          |
| ------------------------------------ | ---------------------------------------------------------------------------------------------------------------------- |
| Domain cannot be scanned             | Confirm it is added as a root domain and allowed by **Settings -> Domains** scope rules.                               |
| Authenticated scan cannot start      | Select **Authenticated** and at least one browser session; validate session readiness.                                 |
| Target is blocking traffic           | Set a lower rate limit, run auto-calibration, allowlist SANDBOX IPs, or enable residential browser traffic.            |
| No actionable trajectories           | Run discovery first, record or import a browser session, or use Manual Crawler to capture user flows.                  |
| Schedule does not behave as expected | Review saved scan config for the selected target. Schedules reuse the configuration sent when the schedule is created. |


# Configure Scan Settings for External Assessment

Configure external assessment settings, including authentication, browser sessions, trajectory scope, rate limits, scan estimates, and browser behavior.

Open the settings drawer from **Modules -> External Assessment -> Discovery Phase** or **Modules -> External Assessment -> Attack Phase** by selecting a target and clicking the settings icon.

Most settings are saved per root entity and module. The review drawer highlights targets whose latest configuration has not been saved.

{% hint style="info" %}
**Video walkthrough:** [Configure an external assessment](https://www.youtube.com/watch?v=O5AbZoO-uP4)
{% endhint %}

{% hint style="info" %}
Severity display is configured separately in **Settings -> External -> Severity Display**. Use **CVSS** for standards-aligned severity bands and compliance reporting. Use **VRT** for Bugcrowd-style P1-P5 priority data on external web and API findings. Learn more at [Bugcrowd VRT](https://bugcrowd.com/vulnerability-rating-taxonomy).
{% endhint %}

<figure><img src="/files/uSyqkej5ZK3145ReWHpm" alt="" width="285"><figcaption></figcaption></figure>

## Authentication Types

Choose how the scanner should interact with the target.

| Mode                | Behavior                                                                                       | Use when                                                                                           |
| ------------------- | ---------------------------------------------------------------------------------------------- | -------------------------------------------------------------------------------------------------- |
| **Unauthenticated** | Tests public pages and APIs without a logged-in browser session.                               | Public surface, marketing pages, unauthenticated APIs, login and registration flows.               |
| **Authenticated**   | Reuses one or more recorded browser sessions. Each session represents a role or account state. | Admin/user role testing, RBAC, IDOR, business logic, tenant isolation, account-specific workflows. |
| **Both**            | Runs unauthenticated and authenticated work.                                                   | You want public and logged-in coverage in one run.                                                 |

Authenticated mode requires at least one browser session. Multiple sessions run separate assessments and are useful for comparing roles.

{% content-ref url="/pages/vJW7K5Y9mXnXTl9AXwwo" %}
[Recording Browser Session](/enterprise/how-to-trigger-an-external-scan/recording-browser-session)
{% endcontent-ref %}

## Browser Session Readiness

The UI checks selected sessions before launch. A session can be blocked or warned when it lacks persisted login data, usable authentication criteria, replay data, or validation results.

If the review drawer reports readiness issues, open the browser session manager, validate the session, or re-record it.

{% content-ref url="/pages/qlsZUTSSIvcyvgbeitK1" %}
[Validating Browser Sessions](/enterprise/how-to-trigger-an-external-scan/validating-browser-sessions)
{% endcontent-ref %}

## Starting Paths

Starting paths control where browser work begins.

* **Unauthenticated starting path** defaults to `/`.
* **Authenticated starting path** defaults to `/`.

Use specific paths when the target has a known entry point, such as `/login`, `/dashboard`, `/admin`, or a tenant-specific route.

## Discovery Type

This appears on the discovery page.

| Option                    | Behavior                                                                                               |
| ------------------------- | ------------------------------------------------------------------------------------------------------ |
| **Run Full Discovery**    | Crawls reachable endpoints and user flows. This is required if discovery should feed the attack phase. |
| **Discover Domains only** | Maps domain and subdomain surface without deep crawling.                                               |

## Auto-Run External Assessment

When **Trigger Attack Phase automatically after discovery** is enabled, Pentest Copilot starts the external assessment after discovery finishes. This option forces full discovery because the attack phase needs pages, APIs, and trajectories to test.

Use this for unattended discovery-to-assessment runs. Leave it disabled when your team wants to review the discovered surface before active testing.

## Attack Vectors

Attack vectors choose which vulnerability categories are tested. The External Assessment settings drawer accepts these category IDs:

```
AUTHENTICATION
OPEN_REDIRECT
AUTHORIZATION
BUSINESS_LOGIC
CACHE
COMMAND_INJECTION
CSRF
DIRECTORY_TRAVERSAL
FILE_UPLOAD
IDOR
INFORMATION_DISCLOSURE
JWT
MASS_ASSIGNMENT
NOSQL_INJECTION
OAUTH
PROMPT_INJECTION
PROMPT_LEAKAGE
PROTOTYPE_POLLUTION
REQUEST_SMUGGLING
SAML
SERIALIZATION
SQL_INJECTION
SSTI
SSRF
WEBSOCKETS
XML
XSS
```

Leaving the list empty is treated as broad coverage.

## Rate-Limit & Egress

This section controls three related things:

1. **Where the traffic comes from** using the selected egress.
2. **How fast the scan is allowed to send requests** using the rate limit.
3. **How much browser work can run in parallel** using the calibrated recommendation and the optional operator cap.

<figure><img src="/files/O0XWpGl31H2R3i3bcyIM" alt="" width="563"><figcaption><p>Configure rate limit and egress</p></figcaption></figure>

### Egress

The selected egress changes the source IP and therefore the target's observed behavior.

| Egress                       | Behavior                                                                     | Use when                                                                                                                    |
| ---------------------------- | ---------------------------------------------------------------------------- | --------------------------------------------------------------------------------------------------------------------------- |
| **SANDBOX egress**           | Browser traffic comes from the Pentest Copilot SANDBOX agent IPs.            | The target can allowlist scanner IPs, traffic must come from a predictable address, or residential proxies are not allowed. |
| **Residential proxy egress** | Browser traffic comes from a residential proxy IP instead of the SANDBOX IP. | Bot defenses or CDN/WAF rules block datacenter traffic and the target allows testing from rotating residential IPs.         |

The page shows the SANDBOX public IPs used for external browser traffic. Share those with the target team when firewall, CDN, or WAF allowlisting is required.

### Use Rotating Residential IPs

This option appears only when **Residential proxy egress** is selected.

By default, a residential run keeps one stable residential exit IP for the whole scan. Enable **Use rotating residential IPs** to spread the scan across the residential proxy pool instead: each browser or scanning job in the run leaves from the next IP in the pool, rotating through many exit IPs.

| Setting           | Behavior                                                                                                         | Use when                                                                                                      |
| ----------------- | ---------------------------------------------------------------------------------------------------------------- | ------------------------------------------------------------------------------------------------------------- |
| **Off** (default) | Every job in the scan uses one fixed residential exit IP.                                                        | The target's defenses or session handling expect a consistent client IP.                                      |
| **On**            | Each job uses the next residential IP in rotation, so consecutive requests are distributed across many exit IPs. | The target throttles or challenges by source IP, or a single residential IP gets rate-limited on longer runs. |

{% hint style="info" %}
Rotation happens per job. A single job (for example one browser flow) still uses one exit IP for all of its own requests, so login and multi-step flows stay on a consistent IP within that job.
{% endhint %}

### Rate Limit (req/min)

**Rate Limit** caps requests per minute for the selected target.

Use a lower value when:

* the target is production and fragile;
* your organization has strict rate limits or WAF thresholds;
* authenticated sessions are easily invalidated;
* the application performs expensive server-side operations.

Leaving the value blank means no explicit per-target cap is applied. Selecting **No rate limit** tells Pentest Copilot to scan at maximum speed.

### Auto-Calibrate

**Auto-calibrate** estimates a sustainable request rate for the currently selected egress. It uses the same selected browser session and custom headers where applicable.

Auto-calibration runs in two phases:

1. **Page-footprint census** measures how "expensive" a real browser page is for the target. Pentest Copilot observes both the scan starting URL and, when an authenticated browser session is selected, the session's authentication verification URL. It records:
   * the initial page-load burst; and
   * the ongoing steady request rate for one browser tab.
2. **Rate-limit probe** ramps request traffic until the target starts throttling or blocking, then stores a recommended per-target request budget for the selected egress.

The drawer then shows:

* the calibrated **Result** in requests per minute;
* a **Confidence** score for that calibration;
* **Recommended max submodules**, derived from the calibrated request budget and the measured page footprint.

If you manually change the rate limit after calibration, the **Recommended max submodules** value updates live in the UI using the same measured page footprint and your new request budget.

{% hint style="warning" %}
Auto-calibration sends intentional probe traffic and may issue a few hundred requests across the census and probe phases. Use it only when that traffic is approved.
{% endhint %}

If every request is blocked, the UI warns that the target is rate-limiting the selected egress. In that case:

* with **SANDBOX egress**, allowlist the SANDBOX IPs on your firewall, CDN, or WAF;
* with **Residential proxy egress**, switch back to SANDBOX egress or use a conservative manual rate limit if residential traffic is blocked or unstable in your environment.

### Max Submodules

**Max Submodules** is an optional operator cap on how many submodules can run at once for that target.

Use it when you want to be more conservative than the calibrated recommendation, for example when:

* the target has burst-sensitive workflows;
* authenticated sessions are fragile;
* a business workflow has expensive writes or background jobs;
* you want to slow one target without lowering the whole workspace.

Leave it empty to let the calibrated recommendation be the only concurrency ceiling.

When both values exist, Pentest Copilot uses the lower of:

* **Recommended max submodules** from calibration; and
* your configured **Max Submodules** value.

This means the manual cap can lower concurrency, but it does not raise concurrency above what calibration considers sustainable.

### Max Concurrent Jobs (Agent)

**Max concurrent jobs** optionally sets how many jobs the agent running this scan may execute at the same time, for the duration of the scan. It overrides the agent's default job concurrency and is automatically restored when the scan ends.

Use it to:

* raise throughput on a dedicated, well-resourced agent for a large target; or
* lower agent load for fragile targets, or when an agent is shared with other work.

Leave it empty to use the agent's configured concurrency.

{% hint style="info" %}
This is different from **Max Submodules**. **Max Submodules** caps how many submodules run at once for this target; **Max concurrent jobs** sets the total job concurrency on the agent itself. If several scans share one agent, the most recently started scan's value applies while it runs, and the agent returns to its normal concurrency once these scans finish.
{% endhint %}

## Trajectory Scope

Trajectories are discovered user flows or API sequences. The settings drawer lets you narrow the run to specific trajectories.

You can:

* search by label, summary, ID, host, path, or method;
* filter by single API, grouped multi-API, cleaned multi-API, or all flows;
* filter by HTTP method;
* select or deselect individual flows;
* select or clear the current page;
* select or deselect all.

The saved configuration stores deselected trajectory IDs. This means newly discovered trajectories are included unless explicitly excluded later.

<figure><img src="/files/XplUUN6Zlfam16IsNVYL" alt="" width="285"><figcaption></figcaption></figure>

## Custom Headers

Custom headers are sent with scan traffic for the selected target. Use them for approved headers such as:

* tenant selectors;
* feature flags;
* testing bypass headers;
* API gateway headers;
* WAF allowlist headers;
* non-secret test tokens.

Do not store production secrets in documentation or screenshots.

## Advanced Options

### Ignore 404 Check

Keeps pages that the platform might otherwise classify as custom 404 pages. Enable when valid app routes look similar to error pages or when 404 pages are intentionally in scope.

### Fail Module on Invalid Session

Stops the module when a selected browser session is invalid, expired, logged out, or cannot be regenerated.

Use this when a partial authenticated run would produce misleading results.

### Skip Browser Session Validation

Skips pre-run browser-session validation checks.

Use only when your team accepts the risk of session-related failures or when a known validation edge case blocks a session that has been manually confirmed as usable.

### Use Residential IP for Browser Traffic

Routes browser traffic through a residential proxy. This helps when bot defenses block datacenter SANDBOX traffic.

Disable it when the target is internal, allowlists only the SANDBOX IP, or must see traffic from a specific source in your environment.

### Isolate Browser Per Job

Runs browser jobs with stronger isolation to reduce stale pages, cookie collisions, and shared browser state issues. This can improve reliability but may make scans slower.

### Use Shared Browser Instance

Runs multiple tabs per browser driver. This can reduce browser startup overhead but may reduce isolation. Use it when targets dislike frequent browser launches and session state is stable across tabs.

### Max Crawler Runs

Limits crawler runs for discovery. Use it to cap exploration on very large or unbounded applications.

## Manual Crawler

Manual Crawler opens a proxied browser so an operator can navigate important flows and save them as trajectories. Use it when:

* the app requires complex human navigation;
* discovery misses a flow;
* a workflow needs specific seeded data;
* an authenticated role has important functionality behind menus or multi-step state.

{% content-ref url="/pages/Qe2U4mKd2ubu7USVan3H" %}
[Manual Crawler](/enterprise/how-to-trigger-an-external-scan/manual-crawler)
{% endcontent-ref %}

## Scan Estimate and Runtime Limit

The review drawer shows estimated duration and scan-hour usage. Estimates can change based on queue depth, worker capacity, selected authentication modes, trajectory count, target count, and whether the workspace runs one worker or parallel workers.

If a **Max module runtime** setting is configured, the review drawer warns that unfinished submodules will be cancelled after that limit.

## Save Configuration and Schedule

Before running or scheduling:

1. Open settings for each target.
2. Save the configuration.
3. Review the drawer for missing saved config warnings.
4. Start immediately or schedule the run from the final review drawer.

Schedules are created from the same run review used for immediate launches. They reuse the target payload and scan configuration included when the schedule is created. Recreate or update schedules after changing important settings such as sessions, rate limits, attack vectors, trajectory exclusions, or target scope.

Manage existing schedules from **Activity -> Schedule**.


# Recording Browser Session

Record Browser Sessions and help Pentest Copilot understand more about the domain.

The Record Browser Session feature enables users to capture interactive browser sessions on a configured sandbox agent. This allows Pentest Copilot to gain a deeper understanding of a target website's structure, user flows, and behaviours. By manually navigating the site, you can simulate specific user roles and permissions, record the session for later replay, and provide Pentest Copilot with the ability to impersonate authenticated users.

{% hint style="info" %}
**Video walkthrough:** [Record a browser session](https://www.youtube.com/watch?v=BNXXiDYV1Zk)
{% endhint %}

{% hint style="info" %}
Learn about [Window Controls](#browser-window-controls) while Recording Browser Session.
{% endhint %}

### Step 1: Prepare the Browser Session

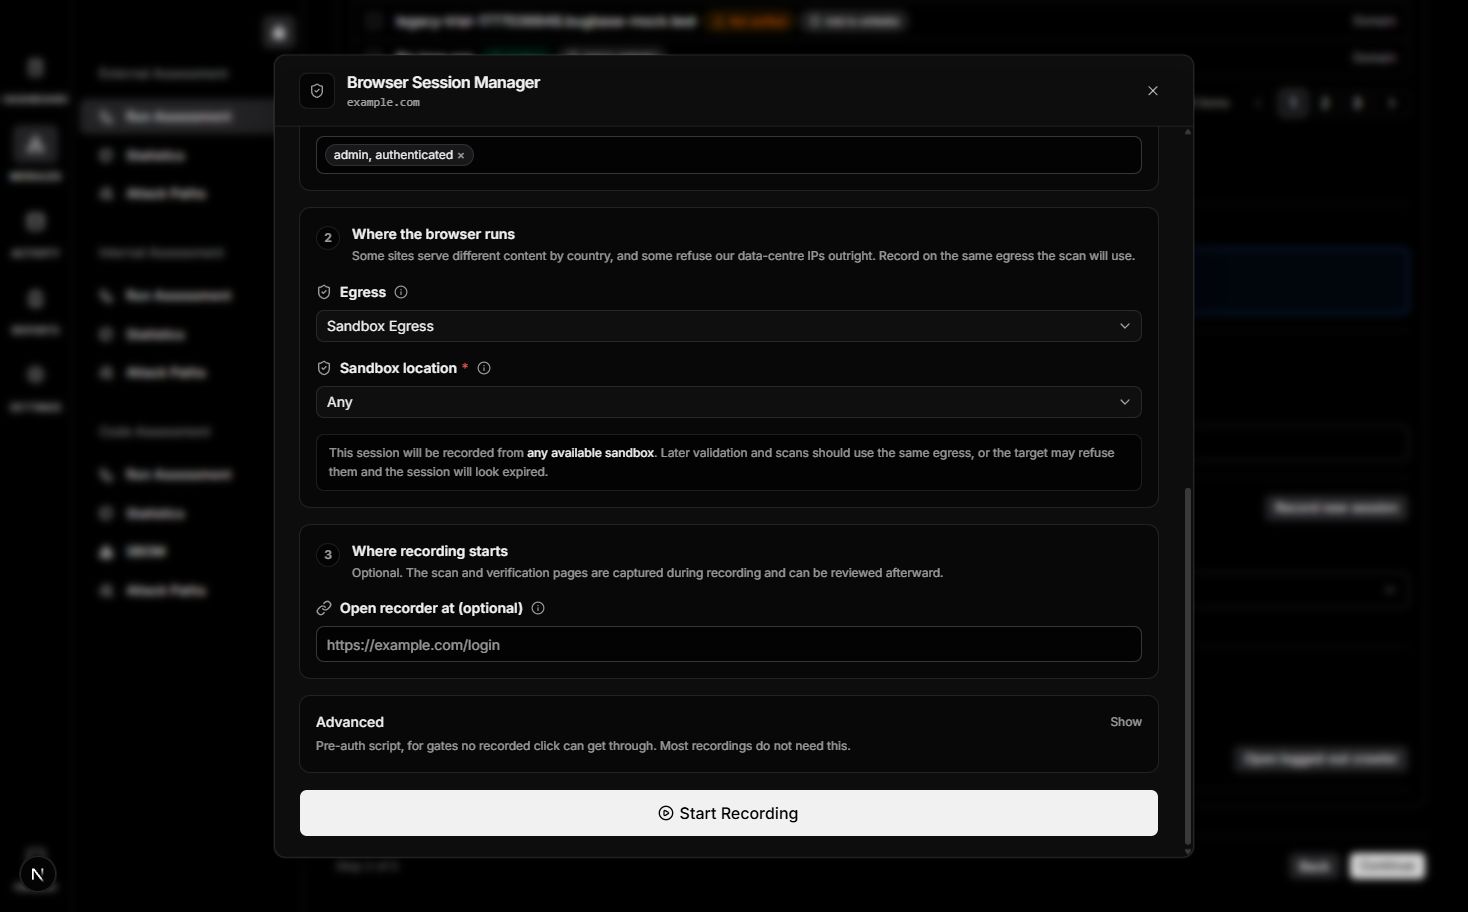
Open the **Browser Session Manager** for the target domain before starting the recorder.

1. Confirm the correct target domain is selected. If the product asks for domain ownership verification, complete verification before recording.
2. Choose whether to create or update a session:
   * **Create New Session** records a new role or account state.
   * **Re-record** updates an existing browser session in place, keeping the same session identity for scans and findings.
3. Select an **Email identity** if the login flow uses email OTPs or magic links. Select **None** when you are using a customer-managed account, an existing long-lived session, or an inbox that Pentest Copilot should not poll.
4. **Session Context**: Provide a clear description of the user role, permissions, and intended functionalities. This metadata helps Pentest Copilot interpret the browser session's scope.
   * **Example**: "Admin user with full access to user management, settings, and reports."
5. **Tags**: Add labels to categorise and filter sessions later. At least one tag is required before recording.
   * **Examples**: "admin", "read-only", "finance-team", "hr-manager".
6. Optional settings:
   * **Authentication Verification Regex**: Text or a regex that should be visible only when the session is authenticated, such as `Dashboard` or `Welcome\s+Jane`.
   * **Starting URL**: Open the recorder directly on the login page or tenant-specific start path.
   * **Use Residential IP for browser traffic**: Use this for bot-sensitive login pages. It may be slower.

Once configured, proceed to start the recording.

<figure><img src="/files/GmUVsjv6Bc5ZmaP9JzRP" alt=""><figcaption></figcaption></figure>

### Step 2: Start Recording

1. Click **Start Recording**.
   * A proxied browser window opens automatically.
   * If the browser window does not open, copy the **Proxied noVNC URL** shown in the active recording card and open it in your browser.

     <figure><img src="/files/QsEsmYA0PfLAhOEVpLSS" alt=""><figcaption></figcaption></figure>

The browser window is now active. You can begin exploring unauthenticated (pre-authentication) features.

{% hint style="info" %}
**Note:** Please wait for page to be loaded and elements to be highlighted before proceeding
{% endhint %}

<figure><img src="/files/utFCVbSsBudzzDfbqxw3" alt=""><figcaption></figcaption></figure>

#### Understanding Record Session Toolbar:

<figure><img src="/files/SuplvP2vqVQcUkoBigQP" alt=""><figcaption></figcaption></figure>

The record session toolbar is identified by the **SESSION** tag present at the start of the toolbar.

| Button             | Function                                                                                                                                                                                                                         |
| ------------------ | -------------------------------------------------------------------------------------------------------------------------------------------------------------------------------------------------------------------------------- |
| **Set Start URL**  | Sets the currently open page as the Start URL. This URL will be used as the entry point when a scan is triggered using this recorded session.                                                                                    |
| **Set Verify URL** | Sets the currently open page as the Verification URL. This URL is used to determine whether the session is successfully authenticated.                                                                                           |
| **Start Auth**     | Marks the beginning of the authentication flow. All actions performed after clicking this button are recorded as Authentication Steps. Once activated, this button automatically changes to Stop Auth.                           |
| **Stop Auth**      | Marks the end of the authentication flow. All actions recorded between Start Auth and Stop Auth are used to regenerate an authenticated session. Any actions performed after this point are marked as Post-Authentication steps. |
| **Refresh**        | Re-applies page highlighting if elements are not properly detected or highlighted during recording.                                                                                                                              |
| **Done**           | Finalizes the recording process and saves the recorded session.                                                                                                                                                                  |

### Handling auth challenges during recording

The VNC browser toolbar includes an **Auth Actions** dropdown for dealing with OTPs, magic links, authenticator apps, and OCR image captchas.

<figure><img src="/files/T3JVYqqTq93LWgEOkDJk" alt=""><figcaption></figcaption></figure>

#### Auth helper toolbar

| Button               | Color  | When to use                                                                     |
| -------------------- | ------ | ------------------------------------------------------------------------------- |
| **TOTP**             | Indigo | Target shows a QR code or Base32 secret for an authenticator app                |
| **Email OTP**        | Green  | Target sent a 6-digit code to the assigned identity selected for this session   |
| **Email Magic Link** | Red    | Target sent a sign-in link to the assigned identity selected for this session   |
| **Phone OTP**        | Purple | Target sent a text-message code for the phone number used in the recording flow |
| **OCR Captcha**      | Blue   | Target shows a captcha image and a textbox where the answer must be entered     |

#### How each button works

| Button               | What happens when you click it                                                                                                                                        |
| -------------------- | --------------------------------------------------------------------------------------------------------------------------------------------------------------------- |
| **TOTP**             | A popup asks for the Base32 secret. Paste it, click OK. Then click the OTP input field on the page. The platform types the current 6-digit code.                      |
| **Email OTP**        | No popup. Status bar shows "Email OTP ready". Click the OTP input field. The platform fetches mail for the selected identity, extracts the code, and types it.        |
| **Email Magic Link** | No popup and no click needed. The platform fetches mail for the selected identity, extracts the link, and navigates directly to it.                                   |
| **Phone OTP**        | Use this when the target sends a text-message code. SMS handling happens through the product flow; messages are not directly forwarded for you to monitor separately. |
| **OCR Captcha**      | Status bar first asks you to click the captcha image, then asks you to click the captcha input. The platform solves the image text and fills the input.               |

<figure><img src="/files/dJUyZA9aXrGfKBfuT6Ur" alt="Popup for totp secret"><figcaption><p>Popup for TOTP secret input</p></figcaption></figure>

#### Where identities come from

<figure><img src="/files/hriWO4w4Erqc8UXD0rj7" alt=""><figcaption></figcaption></figure>

Email OTPs and magic links are tied to the assigned identity selected in the recording form. Later scans poll only that exact inbox, so use one of the identities shown in the product rather than inventing a new plus-address suffix.

Phone OTPs are handled through **Auth Actions** in the VNC browser flow. SMS messages are not directly forwarded for separate monitoring.

For more info how this works refer to:

{% content-ref url="/pages/TZ5SP2OUJviyjLgpvBqw" %}
[Handling Captcha/Email/Mobile OTPs](/enterprise/how-to-trigger-an-external-scan/handling-captcha-email-mobile-otps)
{% endcontent-ref %}

### Step 3: Explore Pre-Authentication Features

* Navigate freely through the website: Click buttons, fill forms, and visit different pages.
* All interactions are automatically categorized as pre-authentication data, building Pentest Copilot's baseline understanding of the site's public-facing elements.
* **Important**: Record representative pages and buttons. You do not need to click every route in the application.

### Step 4: Record Authentication and Post-Authentication Flows

Authentication is a critical phase, as it transitions the session from public to privileged access. Follow these steps to ensure accurate capture:

1. Navigate to the login page.
2. Click **Start Auth** in the recording interface.
   * This flags the start of the login process, allowing Pentest Copilot to distinguish authentication steps from general navigation.
3. Perform login actions:
   * Perform the browser actions that record the browser session.
   * Example (On the OWASP Juice Shop login page):
     * Click the email field
     * Paste credentials (e.g., <admin@juice-sh.op>).
     * Click the password field
     * Paste the credentials (e.g., admin123).
     * Click the **Login** button.
     * **Note**: Actions are recorded in real-time, including any multi-step verification. Make sure to wait till the status button turns green after every action.
4. Once authenticated, click **Stop Auth**
   * This finalises the browser session recording, stores the final browser session.
5. Explore post-authentication features:
   * Test role-specific functionalities (e.g., admin dashboard in Juice Shop).
   * Continue navigating to capture permission-based behaviors.
6. **Lastly, configure an Authentication Verification URL.** This URL is used to verify whether the recorded session is authenticated. During scanning, the system will visit this page to confirm the authentication state.

If needed, use **Set Start URL** to set the starting URL from where the scan will initiate.

### What Gets Recorded

<figure><img src="/files/CCCYMs1clzZfrJZ1u9G7" alt=""><figcaption></figcaption></figure>

Each session captures the browser state needed for replay. Recorded elements include:

* **Cookies**: All authentication and session cookies for maintaining logged-in state.
* **Local Storage**: Persistent browser data (e.g., user preferences).
* **Session Storage**: Temporary data tied to the current session.
* **Cache Storage**: Pre-loaded resources to speed up replays.
* **Indexed DB**: Client-side database entries.
* **Browser Actions**: Sequence of interactions (clicks, keystrokes, form submissions) for step-by-step reproduction.
* **Authentication Verification URL:** Page to visit to confirm/verify authentication
* **Authentication Verification Regex:** A regex match is run against the authentication verification URL - if the matched, user is authenticated.
* **Page Hashes**: Visual and content checksum to validate session stability and detect changes.


# Importing Browser Session

Import an existing browser session JSON bundle.

Use **Import Existing Session** when you already have a browser session JSON bundle from another target, workspace, or previous export.

### Import from JSON

1. Open the target domain settings drawer.
2. Click **Record Browser Session** to open **Browser Session Manager**.
3. In the session selector, choose **Import an existing session**, or switch the mode selector to **Import Existing Session**.
4. Paste the browser session JSON or upload the JSON file.
5. Review or edit the session context, tags, browser actions, and authentication verification regex.
6. Select the email identity for this session, or choose **None** when the imported session uses a customer-managed account or long-lived login.
7. Save the imported session.

The imported session appears in the browser-session dropdown for that target. Validate it before using it for authenticated scans.

{% content-ref url="/pages/qlsZUTSSIvcyvgbeitK1" %}
[Validating Browser Sessions](/enterprise/how-to-trigger-an-external-scan/validating-browser-sessions)
{% endcontent-ref %}

### What the JSON Contains

A browser session JSON bundle can include:

* recorded browser actions;
* cookies and storage;
* authentication verification URL and regex;
* valid-session page hashes;
* WebAuthn credentials;
* email identity metadata;
* session context and tags.

### Legacy Extension Exports

Older browser-session extension exports can still be imported if you have the JSON output. You do not need to install the old Chrome extension to import a session into the current product flow.


# Validating Browser Sessions

Post creation of browser sessions validate them to ensure successful scans

Browser session validation checks that a recorded session works before security scans. It verifies authentication, unauthenticated contrast, action replay, and parallel-tab behavior.

### Validation States

Sessions have three states:

1. **Pending Validation (Yellow)** - Not yet validated. New sessions start here.
2. **Validated (Green)** - All checks passed. Ready for scans.
3. **Validation Failed (Red)** - At least one check failed. Fix issues before using.

### Validation Checks

<figure><img src="/files/vQsgv4Dc5T0tTvi8MYas" alt="" width="375"><figcaption></figcaption></figure>

#### 1. Authenticated Check

Checks whether the session authenticates correctly when loaded.

* Loads the session cookies and storage.
* Visits the authentication URL.
* Compares the result to the expected authenticated page.

Passed: Shows authenticated content (dashboard, profile, etc.)

Failed: Shows login page or error (session expired/invalid)

***

#### 2. Unauthenticated Check

Checks whether the site shows the unauthenticated page when no session is present.

* Visits the same URL without session data.
* Compares the result to the expected unauthenticated page.

Passed: Shows login page or "access denied"

Failed: Shows authenticated content (security issue)

***

#### 3. Replay Test

Checks if the recorded browser actions can be replayed successfully.

* Replays the recorded actions: clicks, typing, and navigation.
* Compares the final page to the expected authenticated state.

Passed: Actions complete and result in authenticated state

Failed: Actions fail or don't reach authenticated state

***

#### 4. Parallel Tab Testing

Checks whether the application can keep three authenticated tabs active at the same time.

* Opens three tabs with the authenticated session.
* Reloads all tabs simultaneously.

Passed: All tabs maintain the authenticated state after reloads

Failed: At least one tab loses the authenticated state.

***

### How to Trigger Validation

1. Open the settings drawer for the target domain and click **Record Browser Session** to open **Browser Session Manager**.

   <figure><img src="/files/ZIY7jwbQ8BF9ALV41lhV" alt=""><figcaption></figcaption></figure>
2. Select an existing session from the dropdown. The session loads in preview mode.
3. (Optional) Review or edit session details, context, tags, or browser actions.
4. Click **Validate Session** and wait for the validation results. Use the VNC URL to watch the validation run when needed.

   <figure><img src="/files/kLsRIoFkxODUIhDxCMfO" alt=""><figcaption></figcaption></figure>
5. Review results when they appear. Green borders = passed, red borders = failed. Click the eye icon to view screenshots.

{% hint style="warning" %}
If any validation check fails, treat the session as unsafe for authenticated scans until it is fixed or re-recorded. Confirm all four checks pass before running an authenticated scan.
{% endhint %}


# Handling Captcha/Email/Mobile OTPs

Pentest Copilot handles verification codes and captchas automatically while you record a login. Record once, the platform re-authenticates on every later test run.

### What the platform handles

| Challenge                | What you do                                                       |
| ------------------------ | ----------------------------------------------------------------- |
| Email OTP                | Click **Auth Actions** > **Email OTP** in the VNC browser toolbar |
| Magic link               | Click **Auth Actions** > **Email Magic Link**                     |
| SMS OTP                  | Click **Auth Actions** > **Phone OTP**                            |
| TOTP (authenticator app) | Paste the Base32 secret into the TOTP helper                      |
| OCR image captcha        | Click **Auth Actions** > **OCR Captcha**                          |
| reCAPTCHA/hCaptcha/etc.  | Nothing                                                           |

### Where to find assigned identities

Open **Browser Session Manager**, choose **Create New Session**, and select one of the email identities assigned to your workspace before clicking **Start Recording**. Later scans poll only the selected identity's inbox for email OTPs and magic links.

Use only identities shown in the product. Do not create your own variants or append suffixes to an address unless that exact identity has been assigned to your workspace.

### Email OTP and magic links

| Scenario                  | Action                                                                                                                                   |
| ------------------------- | ---------------------------------------------------------------------------------------------------------------------------------------- |
| Standard login            | Use the assigned email identity selected for the session. When the target asks for a code, click **Auth Actions** > **Email OTP**.       |
| Magic-link login          | Use the assigned email identity selected for the session. Then click **Auth Actions** > **Email Magic Link**.                            |
| Unique-per-account signup | Select an available assigned identity from the identities area. Random plus-address suffixes are not monitored unless explicitly listed. |
| Target blocks the address | Use another approved assigned identity or ask Bugbase to provision a compatible address for the engagement.                              |

The platform reads the incoming mail, extracts the code or opens the magic link, and continues.

### SMS OTP

Use the phone number shown in the recording flow only when the target requires a phone number. When the target sends a text code, click **Auth Actions** > **Phone OTP** in the VNC browser toolbar.

SMS is handled through the product flow, not by directly monitoring or forwarding text messages to you.

### TOTP (authenticator apps)

When the target shows a QR code or Base32 secret during authenticator setup:

| Step | Action                                                                                             |
| ---- | -------------------------------------------------------------------------------------------------- |
| 1    | Click the **TOTP** button in the recording toolbar                                                 |
| 2    | Paste the Base32 secret, e.g. `JBSWY3DPEHPK3PXP`                                                   |
| 3    | When the target asks for a code, click the OTP field. The platform types the current 6-digit code. |

The secret saves with the session. On every future run, the platform regenerates the current code and types it.

### OCR image captcha

Use **Auth Actions** > **OCR Captcha** when the target shows a text captcha as an image and asks you to type the letters or numbers into a nearby input field.

<figure><img src="/files/P31m9SzEhXjTMx2QscAs" alt=""><figcaption></figcaption></figure>

| Step | Action                                                                                                                                         |
| ---- | ---------------------------------------------------------------------------------------------------------------------------------------------- |
| 1    | Click **Auth Actions** > **OCR Captcha** in the VNC browser toolbar.                                                                           |
| 2    | When the status bar says to click the captcha image, click the image that contains the letters or numbers.                                     |
| 3    | When the status bar says to click the captcha input, click the textbox where the solution should be entered.                                   |
| 4    | Wait while the status bar shows that the captcha is being solved. The platform fills the solved text into the selected input when it is ready. |
| 5    | Continue the login or signup flow normally.                                                                                                    |

The captcha image can be loaded from a normal image URL or embedded directly as base64; Pentest Copilot normalizes either form before solving it. The recorded browser action includes both the captcha image and the input field, so later session replay can solve a fresh image and type the answer into the same field.

Do not manually click and fill the captcha input after using **OCR Captcha**. The OCR Captcha auth action records and performs the fill itself.

### Other captchas

Nothing to do. The platform detects and solves:

* reCAPTCHA v2 and v3
* hCaptcha
* Cloudflare Turnstile
* Non-OCR image, text, and audio puzzles

If the captcha solver cannot complete a challenge during recording, solve it manually and note the case for follow-up.

### Recording checklist

| Step | Action                                                                                                         |
| ---- | -------------------------------------------------------------------------------------------------------------- |
| 1    | Open Browser Session Manager, choose Create New Session, and click Start Recording                             |
| 2    | Select the assigned identity to use for this session                                                           |
| 3    | During login, use **Auth Actions** for Email OTP, Email Magic Link, Phone OTP, TOTP, or OCR captcha challenges |
| 4    | For TOTP, use the helper button when the target shows a Base32 secret                                          |
| 5    | For OCR image captchas, click the captcha image first, then the captcha input when the status bar asks         |
| 6    | Let reCAPTCHA, hCaptcha, Turnstile, and other supported captchas resolve on their own                          |
| 7    | Finish the login, stop recording, save                                                                         |

### FAQ

| Question                                                 | Answer                                                                                                                       |
| -------------------------------------------------------- | ---------------------------------------------------------------------------------------------------------------------------- |
| Are the assigned inboxes real?                           | Yes. Each assigned identity is monitored for the workspace and can be selected when recording a browser session.             |
| Can I append my own suffix to an assigned email address? | No. Later scans poll only the exact identity selected for the session.                                                       |
| Can I monitor SMS messages directly?                     | No. Use the **Phone OTP** Auth Action in the VNC browser flow when the target sends a text code.                             |
| What if a code expires before it's used?                 | Polling runs every few seconds, so timeouts are rare. Failed runs are flagged for re-recording.                              |
| Is my TOTP secret secure?                                | It's stored inside the session record in your workspace, not shared across tenants.                                          |
| What if the OCR captcha answer is wrong?                 | Reload the captcha and run **OCR Captcha** again. If it repeatedly fails, solve it manually and note the case for follow-up. |
| Do I need my own Capsolver or 2Captcha account?          | No. Captcha solving is included.                                                                                             |

### On-premise or custom tenant?

If you're running Pentest Copilot on your own infrastructure or need dedicated identities (e.g. because the target allow-lists specific domains), we can provision approved email or phone values for the engagement. Captcha auto-solve can also be disabled per deployment when manual solving is required.


# Manual Crawler

Record Trajectories Manually

Manual Crawler allows you to manually navigate through a website and create trajectories (sequences of actions) that can be tested and replayed. This is useful for creating specific test scenarios or exploring complex user flows.

#### **Browser Session Selection (Optional)**

Select an existing browser session to use for authenticated manual crawling

**How to use:**

* Click the dropdown to see available browser sessions.
* Select a session if you want to crawl authenticated areas.
* Leave empty for unauthenticated crawling.

#### Using Manual Crawler

1. **Start the crawler:**
   * Click **Start Manual Crawler**.
   * A proxied browser window opens on the **SANDBOX** agent. This may take a few seconds.
   * If the browser window does not open automatically, click **Open proxied browser** from the active crawler card.
2. **Understanding the Toolbar:**

The browser window includes a toolbar with these controls:

* **Status Indicator (Green/Yellow Dot):**
  * **Green:** System is waiting for your action
  * **Yellow:** System is processing your last action
  * **Red:** Error occurred
* **Status Text:**
  * Shows current state: "Waiting for action", "Processing...", "Loading page..."
* **Start Recording:**
  * Starts recording a new trajectory from the current page.
  * Use this when you want to capture a menu, form, or multi-step flow that automated discovery missed.
* **Reset:**
  * Stops the current trajectory recording and resets back to the starting point.
* **Done:**
  * Saves the trajectories you created and ends the manual crawler session.
* **Abort:**
  * Stops the manual crawler without saving the current in-progress trajectory.


# How to Trigger a Code Assessment

Follow these steps to connect GitHub repositories and run a Code Assessment in Pentest Copilot Enterprise.

Code Assessment reviews source repositories connected through the Pentest Copilot GitHub App. It helps security and engineering teams find vulnerable code paths, risky dependencies, leaked secrets, authorization issues, business-logic weaknesses, and software/AI inventory gaps before code reaches production.

{% hint style="info" %}
Code Assessment scans code available in GitHub. It does not scan unpushed local changes on a developer workstation.
{% endhint %}

## Code Assessment Flow

1. Connect the GitHub App.
2. Select or connect repositories.
3. Configure repository scan settings.
4. Choose manual, scheduled, pull request, or push-triggered scans.
5. Review findings, fix pull requests, SBOM exports, and AI-BOM exports.

## 1. Connect the GitHub App

Open **Settings -> Integrations -> GitHub** or **Modules -> Code Assessment** and start the GitHub connection flow.

{% content-ref url="/pages/cSYGK9VOV5u61rz8tVT0" %}
[Configure GitHub for Code Assessment](/enterprise/how-to-trigger-a-code-assessment/configure-github-for-code-assessment)
{% endcontent-ref %}

During the GitHub installation:

* choose the GitHub organization or account that owns the repositories;
* grant access to all repositories or selected repositories;
* confirm the installation and return to Pentest Copilot.

If the GitHub App was already installed, confirm that the required repositories are included in the installation's repository access list.

{% hint style="info" %}
You only need to install the GitHub App from Pentest Copilot. No separate GitHub App setup is required.
{% endhint %}

## 2. Select Repositories

Open **Modules -> Code Assessment**.

The repository table shows GitHub repositories that Pentest Copilot can access. Select one or more repositories to include in the run.

The **Branch** column shows the repository's default branch. If you start a manual run without entering a branch or commit, Pentest Copilot scans that default branch.

You can also connect a repository to a domain from the GitHub integration screen. Domain-connected repositories allow external findings on that domain to be patched against the matching source repositories.

{% hint style="warning" %}
Manual runs use the code currently available in GitHub. If a developer has local changes that are not pushed, those changes are not included.
{% endhint %}

## 3. Configure Scan Settings

Click the settings icon for a repository to open **Scan settings**.

Use scan settings to decide:

* which checks should run;
* whether GitHub pull requests or pushes should trigger automatic scans;
* which branches push scans should watch;
* what should happen when Pentest Copilot confirms a finding that can be fixed automatically.

{% content-ref url="/pages/jCO3SrYhFV3I1FvxB9FK" %}
[Configure Scan Settings for Code Assessment](/enterprise/how-to-trigger-a-code-assessment/configure-scan-settings-for-code-assessment)
{% endcontent-ref %}

## 4. Run or Schedule the Assessment

After selecting repositories, click **Run Code Assessment**.

Before launch, review the selected repositories and choose a branch or commit if you want to scan something other than the default branch.

| Run type                              | What gets scanned                                                                                     |
| ------------------------------------- | ----------------------------------------------------------------------------------------------------- |
| **Manual run with no branch entered** | The repository default branch shown in the table.                                                     |
| **Manual run with a branch entered**  | The named branch in GitHub.                                                                           |
| **Manual run with a commit entered**  | That exact Git commit.                                                                                |
| **Scheduled run**                     | The saved run configuration at the time the schedule was created.                                     |
| **Pull request automation**           | The latest commit on the pull request.                                                                |
| **Push automation**                   | The commit that was pushed, if push scans are enabled and the branch matches the repository settings. |

Use **Schedule** when the same repositories should be assessed on a recurring cadence.

## 5. Monitor the Run

Open **Activity -> Activity** to follow the module status.

The Activity page shows whether the assessment is pending, running, completed, failed, cancelled, or scheduled. If a run fails, start here before judging coverage.

{% content-ref url="/pages/QJ9ahgjtOWQNnN87Ivzs" %}
[Activity](/enterprise/activity)
{% endcontent-ref %}

## 6. Review Results

After assessment completes:

* open **Modules -> Code Assessment -> Statistics** for aggregate severity, category, and trend views;
* open **Modules -> Code Assessment -> Attack Paths** for validated findings and remediation guidance;
* open a finding detail page to review evidence, AI reasoning, affected files, fix guidance, status, and retest controls;
* open **Modules -> Code Assessment -> SBOM** to review inventory verification and download SPDX, CycloneDX, and AI-BOM exports.

{% content-ref url="/pages/yIa5DS9u5uSEnjRhi5DZ" %}
[Analysing Scan Results](/enterprise/analysing-scan-results)
{% endcontent-ref %}

## Common Blocks

| Block                                | What to check                                                                                                                                              |
| ------------------------------------ | ---------------------------------------------------------------------------------------------------------------------------------------------------------- |
| GitHub App is not connected          | Open **Settings -> Integrations -> GitHub** and complete the GitHub App installation.                                                                      |
| Repository is missing                | Confirm the repository is included in the GitHub App installation's repository access list.                                                                |
| Unsure which branch was scanned      | Check whether the run used a manual branch or commit, the repository default branch, pull request automation, or push automation.                          |
| Pull request scan did not run        | Confirm **Scan every pull request** is enabled for that repository and that the pull request was opened, reopened, or updated after the setting was saved. |
| Push scan did not run                | Confirm **Scan pushes** is enabled and the pushed branch matches the branch filters. With no filter, only the default branch is scanned.                   |
| Auto-fix did not open a pull request | Confirm the finding is validated, fixable, and the repository is configured for **Auto PR**.                                                               |
| Inventory exports are unavailable    | Confirm the assessment completed far enough to build the inventory, then open **Modules -> Code Assessment -> SBOM**.                                      |


# Configure GitHub for Code Assessment

Connect the Pentest Copilot GitHub App, choose repositories, and enable pull request or push automation for Code Assessment.

Code Assessment connects to GitHub through the Pentest Copilot GitHub App.

After the GitHub App is installed, Pentest Copilot can read selected repositories, create check results, comment on pull requests, create issues, and open fix pull requests when you enable those workflows.

## Before You Start

You need:

* access to Pentest Copilot with permission to manage integrations or run Code Assessment;
* GitHub permission to install a GitHub App on the target organization or account;
* approval for the repositories that will be scanned;
* for automatic pull request or push scans, the repository must be connected in Pentest Copilot and have scan settings saved.

{% hint style="warning" %}
Installing the GitHub App alone does not automatically scan every repository. Automatic scans only start for repositories that you connect and configure in Pentest Copilot.
{% endhint %}

## Connect the GitHub App

1. In Pentest Copilot, open **Settings -> Integrations -> GitHub** or **Modules -> Code Assessment**.
2. Click **Connect GitHub**.
3. GitHub opens the Pentest Copilot GitHub App installation page.
4. Choose the GitHub organization or account.
5. Select **All repositories** or **Only select repositories**.
6. Approve the installation.
7. Return to Pentest Copilot and confirm the integration shows as connected.

If a repository is missing, open the GitHub App installation settings in GitHub and add that repository to the App's repository access list.

## Use the Right Pentest Copilot Account

Always start the installation from **Connect GitHub** inside the Pentest Copilot account where you want the repositories to appear.

{% hint style="info" %}
If your organization uses more than one Pentest Copilot account or workspace, open the correct one before connecting GitHub.
{% endhint %}

## Connect Repositories in Pentest Copilot

After the App is installed, open **Settings -> Integrations -> GitHub** or **Modules -> Code Assessment**.

You can configure repositories in two ways:

| Repository setup                          | What it does                                          | Use when                                                                                                      |
| ----------------------------------------- | ----------------------------------------------------- | ------------------------------------------------------------------------------------------------------------- |
| **Standalone Code Assessment repository** | Adds the repository as a Code Assessment target.      | You want source-code scans, scheduled scans, pull request scans, push scans, SBOM, AI-BOM, and code findings. |
| **Repository connected to a domain**      | Links a repository to an external application domain. | You want external findings on that domain to be patchable against the connected source repositories.          |

You can use both. A repository can be a direct Code Assessment target and also be connected to a domain.

## Enable Automatic Scans

Automatic scans are configured per repository from **Modules -> Code Assessment -> Scan settings**.

| Trigger          | Default | What is scanned                                                                                              |
| ---------------- | ------- | ------------------------------------------------------------------------------------------------------------ |
| **Pull request** | On      | The latest commit on the pull request.                                                                       |
| **Push**         | Off     | The commit that was pushed, only when push scans are enabled and the branch matches the repository settings. |

Pull request scans run when a pull request is opened, reopened, marked ready for review, or updated with new commits.

Push scans ignore tags and branch deletions. With no branch filter, push scans run only on the repository default branch. With branch filters, the pushed branch must match one of the saved regular expressions.

Examples:

| Branch filter | Matches                                                        |
| ------------- | -------------------------------------------------------------- |
| `main`        | Only `main`.                                                   |
| `release/.*`  | Branches such as `release/2026.07` and `release/hotfix`.       |
| `feature/.+`  | Feature branches with at least one character after `feature/`. |

## Common Blocks

| Block                                                                | What to check                                                                                                                                |
| -------------------------------------------------------------------- | -------------------------------------------------------------------------------------------------------------------------------------------- |
| GitHub redirects to the App settings page instead of Pentest Copilot | Start the install again from **Connect GitHub** in Pentest Copilot. If it still does not return to Pentest Copilot, contact BugBase support. |
| Repository does not appear                                           | Confirm the App installation has access to that repository.                                                                                  |
| Pull request event did not start a scan                              | Confirm the repository is connected in Pentest Copilot and **Scan every pull request** is enabled for that repository.                       |
| Push event did not start a scan                                      | Confirm **Scan pushes** is enabled and the pushed branch matches the saved branch filters.                                                   |
| Repositories appear in the wrong Pentest Copilot account             | Disconnect GitHub and reconnect it from the account where you want to run Code Assessment.                                                   |


# Configure Scan Settings for Code Assessment

Configure Code Assessment settings, including checks, automation triggers, branch behavior, auto-fix, and SBOM and AI-BOM exports.

Open the settings drawer from **Modules -> Code Assessment** by selecting a repository and clicking the settings icon.

Settings are saved per repository. Manual runs, schedules, and automatic scans use the saved settings for that repository.

{% hint style="info" %}
Automatic scans run after matching GitHub pull request or push activity. They do not scan an unpushed local working tree.
{% endhint %}

## Checks

Checks decide what Pentest Copilot should look for in the repository.

| Check                                | Outcome                                                                                                                                                                                                                                   | Use when                                                                                    |
| ------------------------------------ | ----------------------------------------------------------------------------------------------------------------------------------------------------------------------------------------------------------------------------------------- | ------------------------------------------------------------------------------------------- |
| **Vulnerable code paths**            | Finds risky code paths such as user-controlled data reaching database queries, command execution, file access, SSRF, XSS, deserialization, or similar sinks. Findings include affected files, evidence, impact, and remediation guidance. | You want source-code vulnerability review similar to SAST, but with exploitability context. |
| **Open-source dependency risk**      | Reviews manifests and lockfiles for vulnerable packages, affected versions, CVEs, and upgrade guidance.                                                                                                                                   | You need software composition analysis for third-party dependencies.                        |
| **Leaked secrets and credentials**   | Detects committed API keys, tokens, private keys, cloud credentials, and similar secrets.                                                                                                                                                 | You want to catch credential exposure before it reaches production or long-lived branches.  |
| **Business logic and authorization** | Reviews authorization boundaries and workflows for issues such as IDOR, tenant isolation gaps, role bypass, approval abuse, payment logic flaws, and unsafe state transitions.                                                            | You want deeper review of application behavior that simple pattern matching may miss.       |
| **Run AI Inventory with each scan**  | Maps AI/LLM usage, model providers, prompt surfaces, and inference locations during each scan.                                                                                                                                            | You need visibility into AI usage for governance, review, or AI-BOM export.                 |

Enable the checks that match the review outcome you need. For a first run, keep all checks enabled so the first result set becomes a baseline.

## Automation

Automation controls when the GitHub App should start scans automatically.

| Option                      | What it does                                                                                                                       | Branch behavior                                                        |
| --------------------------- | ---------------------------------------------------------------------------------------------------------------------------------- | ---------------------------------------------------------------------- |
| **Scan every pull request** | Runs when a pull request is opened, reopened, marked ready for review, or updated. Results are reported back on that pull request. | Scans the latest commit on the pull request.                           |
| **Scan pushes**             | Runs when commits are pushed to matching branches.                                                                                 | With no branch filter, pushes scan only the repository default branch. |
| **Branch filters**          | Limits push-triggered scans to specific branches or branch patterns.                                                               | Use regular expressions such as `main`, `release/.*`, or `feature/.+`. |

Use pull request scans when you want feedback before merge. Use push scans when you want continuing coverage on important branches after code is merged.

{% hint style="warning" %}
Branch filters are regular expressions matched against the full branch name. `release/.*` matches `release/2026.07`; `release/*` is not the same pattern.
{% endhint %}

## Manual Runs and Branch Selection

Manual runs are started from **Modules -> Code Assessment** with **Run Code Assessment**.

If you leave the branch or commit field blank, Pentest Copilot scans the repository default branch shown in the table. If you enter a branch name, tag, or commit SHA, the run uses that branch, tag, or commit instead.

| Scenario                            | What Pentest Copilot scans                                                                                               |
| ----------------------------------- | ------------------------------------------------------------------------------------------------------------------------ |
| **Manual run, branch field blank**  | The default branch shown in the repository table.                                                                        |
| **Manual run, branch name entered** | That branch in GitHub.                                                                                                   |
| **Manual run, commit SHA entered**  | That exact commit.                                                                                                       |
| **Pull request automation**         | The latest commit on the pull request.                                                                                   |
| **Push automation**                 | The commit that was pushed, if the branch matches the branch filter. With no filter, only the default branch is scanned. |

## Auto-fix

Auto-fix controls what happens after Pentest Copilot confirms a finding is real and safe to patch automatically.

| Mode        | Behavior                                                                                                               | Use when                                                                      |
| ----------- | ---------------------------------------------------------------------------------------------------------------------- | ----------------------------------------------------------------------------- |
| **Off**     | Pentest Copilot does not generate patches. Findings remain as evidence and remediation guidance only.                  | Your team wants manual remediation or is still evaluating the module.         |
| **Suggest** | Pentest Copilot marks confirmed findings that can be fixed automatically. A user chooses when to generate the patch.   | Your team wants control before patches are created.                           |
| **Auto PR** | After confirmation, Pentest Copilot creates a patch branch and opens a GitHub pull request against the scanned branch. | Your team wants an automated remediation workflow for safe, fixable findings. |

When enabled, fix pull requests can also be commented back on the triggering pull request so reviewers can follow the remediation path from GitHub.

{% hint style="warning" %}
Auto-fix does not mean every finding will receive a patch. Pentest Copilot only generates fixes for findings it confirms as fixable and safe to patch automatically.
{% endhint %}

## SBOM and AI-BOM Exports

Open **Modules -> Code Assessment -> SBOM** after a completed assessment.

This page shows the repository inventory and the **AI-BOM + SBOM verification** result. Pentest Copilot cross-checks whether the software bill of materials and AI bill of materials are internally consistent before export.

The verification view helps confirm:

* package totals and direct dependency totals match the collected inventory;
* ecosystems are summarized consistently;
* AI inference locations and AI component records are linked to evidence;
* the AI file index is present when AI usage is found.

Download options are shown clearly on the SBOM page:

| Export                 | Use for                                                                                                         |
| ---------------------- | --------------------------------------------------------------------------------------------------------------- |
| **SPDX 2.3 JSON**      | Standards-aligned software bill of materials review, vendor requests, audit workflows, and compliance evidence. |
| **CycloneDX 1.6 JSON** | Dependency governance, security tooling ingestion, and supply-chain workflows that expect CycloneDX.            |
| **AI-BOM JSON**        | AI/LLM governance, model/provider review, prompt-surface review, and AI usage inventory.                        |

## Recommended Defaults

| Situation                        | Recommended settings                                                                                                                    |
| -------------------------------- | --------------------------------------------------------------------------------------------------------------------------------------- |
| **First repository baseline**    | Enable all checks, enable AI inventory, keep auto-fix **Off** or **Suggest**, and run the default branch manually.                      |
| **Pull request security review** | Enable **Scan every pull request** and keep auto-fix **Suggest** until the team is comfortable with generated patches.                  |
| **Main branch monitoring**       | Enable **Scan pushes** and leave branch filters blank for default-branch-only coverage, or add filters such as `main` and `release/.*`. |
| **Mature remediation workflow**  | Use **Auto PR** after your team has reviewed the quality of suggested fixes on representative findings.                                 |

## Before Enabling Automation

Check:

* the GitHub App has access to the intended repositories;
* branch filters match the branches your team actually uses;
* repository owners know where Code Assessment comments and pull requests will appear;
* auto-fix mode matches your change-management process;
* SBOM, CycloneDX, SPDX, and AI-BOM exports are reviewed by the right security or compliance owner.


# How to Trigger an Internal Scan

Follow these steps to initiate an internal scan in Pentest Copilot Enterprise.

Internal scanning runs through a local agent deployed in your environment. The agent receives jobs from Pentest Copilot, executes tooling from inside your network, and streams results back to the control plane.

{% hint style="warning" %}
Internal assessment can run active exploitation. Some exploit families can modify AD/ADCS, deploy callbacks, collect files, use credentials, forge tickets, or change host state. Review approved scope before launching.
{% endhint %}

## Internal Scan Flow

1. Connect a local AGENT.
2. Run internal discovery.
3. Review discovered subnets, hosts, users, groups, services, and credentials.
4. Select subnets for internal assessment.
5. Configure agents, allowed exploits, exclusions, PCE Intercept/Inveigh, and RCE controls.
6. Review estimates and destructive-action warnings.
7. Run immediately or schedule from the final run review.
8. Review attack paths and cleanup implications.

## 1. Connect a Local Agent

Open **Settings -> Agent** or **Download Agent** and download the installer for your environment.

The agent must be installed on a host that can route to the approved internal subnets. RTCS assigns the concrete agent identity when the agent connects; do not supply your own agent ID.

After connection, confirm the agent appears in **Dashboard -> Agents** or **Settings -> Agent** with a connected status, subnets, and network interfaces.

{% content-ref url="/pages/qJVQdMWQN3SOOKDv02QD" %}
[Download Agent](/enterprise/download-agent)
{% endcontent-ref %}

## 2. Run Internal Discovery

Open **Modules -> Internal Assessment -> Discovery Phase**.

1. Select a connected agent.
2. Review the subnets reported by that agent.
3. Select the subnet or subnets to discover.
4. Optionally add **Partial Subnet Testing** values:
   * single IP, such as `10.10.10.25`;
   * range, such as `10.10.10.20-10.10.10.50`;
   * CIDR, such as `10.10.10.0/24`.
5. Set a confidence level if the operator wants to document certainty in scope.
6. Optionally enable **Trigger Internal Assessment automatically after discovery** if the deployment exposes that control and your team wants an unattended discovery-to-assessment run.
7. Review the estimate and runtime limit warning.
8. Click **Run Discovery** to open the final review, then either start immediately or schedule discovery for later.

Discovery populates the graph with subnets, hosts, services, users, groups, credentials, and other internal entities that the assessment phase can use.

## 3. Open Internal Assessment

Open **Modules -> Internal Assessment -> Attack Phase**.

The page lists discovered subnets. Select the subnets in scope for active assessment.

For each selected subnet, configure:

* **Agent**: the agent that will execute the subnet assessment. Agents in the same subnet are prioritized and labeled.
* **Confidence Level**: operator certainty that target and scope are correct. Use `0` when unsure.
* **Settings**: per-subnet attack settings, exploit selection, and entity exclusions.

## 4. Configure Per-Subnet Settings

Click the settings icon for a selected subnet.

### PCE Intercept/Inveigh

Enable **Start PCE Intercept/Inveigh** only when NTLM capture/relay is approved for the engagement.

When enabled:

* choose one or more interfaces on the selected agent;
* the assessment starts PCE Intercept/Inveigh and ntlmrelayx for the subnet;
* if no interface is selected, the run is blocked until fixed.

### RCE Execution Controls

The drawer includes:

* **Skip RCE if host is already compromised**.
* **Skip RCE if user is already compromised**.

Keep these disabled to run every enabled RCE submodule. Enable them when your team wants to avoid repeated command execution after the graph already proves compromise.

### Exploits Tab

The **Exploits** tab lists exploit families returned by the backend. By default, selected subnets start with all exploit families enabled.

Disable any family that is not approved for the engagement.

The UI labels high-impact categories, such as AD write, DC password, ADCS write, host change, credential use, ticket forging, and data copy. The final review includes a destructive-action warning summary.

{% content-ref url="/pages/Wo8uaAQGOpoDSX3mEaRZ" %}
[Internal Assessment Destructive Actions](/enterprise/how-to-trigger-an-internal-scan/internal-assessment-destructive-actions)
{% endcontent-ref %}

### Entities Tab

The **Entities** tab shows graph entities connected to the selected subnet, such as hosts, users, groups, and services.

By default, entities are included. To exclude entities:

1. Open the **Entities** tab.
2. Search or page through the entity list.
3. Uncheck entities that should not be tested.
4. Refresh the entity list if discovery has recently added more data.

The exclusion count is shown in the subnet settings and final review.

## 5. Review, Run, or Schedule

Click **Run Assessment** to open the final configuration review.

Review:

* selected subnets;
* assigned agents;
* confidence levels;
* enabled exploit count;
* PCE Intercept/Inveigh status and selected interfaces;
* excluded entity count;
* scan estimate and credit/runtime information;
* destructive-action warning summary;
* max module runtime warning, if configured.

Click **Run assessment** to launch immediately. If scheduling is permitted for your role, use the schedule controls in the same review drawer to run later or create a recurring assessment.

## 6. Schedule Internal Assessment

Scheduling uses the selected subnets and the same module configuration shown in the final review. It captures agent assignment, confidence levels, exploit choices, exclusions, PCE Intercept/Inveigh settings, RCE controls, scan estimates, and the saved scan configuration reference at the time the schedule is created.

Schedules can be one-time or recurring. Manage existing schedules from **Activity -> Schedule**.

{% content-ref url="/pages/LLoc9R3DJqOcKInTTM8W" %}
[Scheduling](/enterprise/activity/scheduling)
{% endcontent-ref %}

## 7. Monitor and Triage

Use:

* **Activity -> Activity** for module and submodule execution status.
* **Activity -> Attack Logs** for detailed operational logs.
* **Modules -> Internal Assessment -> Statistics** for aggregate results.
* **Modules -> Internal Assessment -> Attack Paths** for findings.
* **Reports** for executive or comprehensive PDFs.

## Common Blocks

| Block                                      | What to check                                                                                   |
| ------------------------------------------ | ----------------------------------------------------------------------------------------------- |
| No agents available                        | Confirm the AGENT is connected and visible in **Dashboard -> Agents** or **Settings -> Agent**. |
| No subnets shown                           | Confirm the agent reports subnets and can route to your network.                                |
| Intercept enabled but run blocked          | Select at least one valid interface for PCE Intercept/Inveigh.                                  |
| Exploit family not approved                | Disable it in the subnet settings drawer before review.                                         |
| RCE should not repeat on compromised nodes | Enable the RCE skip controls.                                                                   |
| Assessment is too broad                    | Use partial subnet testing during discovery and entity exclusions during assessment.            |


# Internal Assessment Destructive Actions

Understand which Internal Assessment exploit categories can make persistent, destructive, or hard-to-revert changes.

Internal Assessment can simulate real adversary activity inside Active Directory and connected hosts. Some exploit categories only validate exposure or collect evidence. Others can change account state, directory permissions, certificate services, delegation settings, host configuration, or credential material.

Pentest Copilot highlights these selections in the final configuration review. The product warning is intentionally short so operators can make a fast decision before launching the assessment. This page explains the impact behind those warnings in plain language.

## Before enabling high-impact exploit categories

Before running an internal assessment with destructive or hard-to-revert categories enabled:

* Confirm the engagement allows active exploitation, not only enumeration.
* Confirm who owns rollback for Active Directory, certificate services, GPOs, delegation settings, and endpoint cleanup.
* Snapshot lab or staging domains where possible.
* Keep domain controller recovery procedures ready before enabling domain controller authentication-bypass testing.
* Plan credential rotation for any password, hash, Kerberos ticket, trust key, KRBTGT material, or LAPS password recovered during the run.
* Disable any exploit category that is outside the approved engagement scope.

## Critical Active Directory and certificate-service changes

These categories can directly change Active Directory, Active Directory Certificate Services, or domain controller state.

### ACL Privilege Escalation

This category abuses dangerous permissions that a user or group has over another Active Directory object. Examples include rights to reset a password, add a member to a group, write to an object, change object ownership, or modify object permissions.

**What Pentest Copilot may do**

* Reset an AD user's password to prove the account can be taken over.
* Add a user or computer to an AD group when group-control permissions allow it.
* Grant additional control over an AD object by changing its permissions.
* Change the owner of an AD object and then use that ownership to gain more control.
* Add certificate or key-based logon material to an account to recover credential material.
* Abuse GPO control to create a local administrator account on affected machines.
* Read LAPS-managed local administrator passwords if the discovered permissions allow it.

**What can remain changed**

* User passwords.
* Group membership.
* Object permissions and owners.
* GPO-controlled local administrator changes.
* Certificate or key-based account login material.
* Recovered local administrator credentials.

**Cleanup expectations**

* Restore changed passwords.
* Remove added group members.
* Revert object owner and permission changes.
* Remove GPO artifacts and any local administrator accounts created through GPO abuse.
* Review affected accounts for unexpected certificate or key-based login material.
* Rotate any recovered credentials or LAPS passwords.

### Resource-Based Constrained Delegation

This category abuses delegation settings that allow one computer account to impersonate users to another computer. In practice, this can let an attacker act as an administrator to a target host.

**What Pentest Copilot may do**

* Create a controlled computer account in Active Directory.
* Change the target computer's delegation configuration so the controlled account can impersonate users to that target.
* Request Kerberos tickets through the new delegation path.
* Use those tickets for follow-on access to the target system.

**What can remain changed**

* A newly created computer account.
* Delegation settings on the target computer object.
* Kerberos tickets or credential material generated through the delegation path.

**Cleanup expectations**

* Delete the controlled computer account created during the assessment.
* Clear the target computer's resource-based delegation setting.
* Review ticket use from the delegated identity.

### Domain Controller Authentication Bypass

This category validates high-impact domain controller authentication-bypass conditions, such as ZeroLogon-style abuse. A successful exploit can take over a domain controller and expose domain credential material.

**What Pentest Copilot may do**

* Attempt the authentication bypass against a domain controller.
* Reset the domain controller machine-account password as part of the takeover path.
* Collect password hashes or other credential material from the domain controller after takeover.

**What can remain changed**

* The domain controller machine-account password.
* Domain credential material exposed during collection.
* Domain controller health if the machine-account password is not restored correctly.

**Cleanup expectations**

* Restore the domain controller machine-account password immediately.
* Verify domain controller health, trust, replication, and authentication behavior.
* Treat any recovered domain credential material as compromised.

### ADCS Certificate Abuse

This category abuses unsafe Active Directory Certificate Services configuration. Certificate abuse can allow privileged impersonation even when the original password is unknown.

**What Pentest Copilot may do**

* Request certificates that allow impersonation of privileged users.
* Forge or use certificates to recover credential material.
* Temporarily change a certificate template when the attack path requires it.
* Modify certificate authority permissions or enable a dangerous template when the attack path requires it.
* Change account attributes or certificate login material for certificate-based impersonation.
* Relay authentication to certificate enrollment services.
* Access certificate authority material when administrative access to the certificate authority is available.

**What can remain changed**

* Certificate template permissions or settings.
* Certificate authority officer or enrollment settings.
* Issued or failed certificate requests.
* Account attributes used for certificate mapping.
* Certificate or private-key artifacts created during exploitation.
* Credential material recovered through certificate authentication.

**Cleanup expectations**

* Review and revert certificate authority permission changes.
* Review enabled templates and template permissions.
* Review issued and failed certificate requests.
* Remove unintended account attribute or certificate-mapping changes.
* Revoke certificates where appropriate.
* Rotate credentials recovered through certificate authentication.

## High-impact host, credential, and ticket actions

These categories may not always write directly to Active Directory, but they can deploy implants, extract reusable credentials, forge tickets, or move laterally.

### Remote Code Execution

This category uses valid access or a confirmed vulnerability to run commands on a reachable host.

**What Pentest Copilot may do**

* Run commands over Windows or Linux administration protocols.
* Run commands through a database server when database-level command execution is available.
* Deploy and start a callback agent or implant.
* Mark the host as compromised and run follow-on post-compromise checks.
* Enable operating-system command execution through a database feature when that is part of the path.

**What can remain changed**

* Dropped payloads, callback agents, services, scheduled tasks, or temporary files.
* Host configuration changed to enable command execution.
* Logs and security telemetry generated by command execution.

**Cleanup expectations**

* Remove deployed agents, services, scheduled tasks, and temporary payloads.
* Disable database command-execution features if they were enabled.
* Review host logs and endpoint state.

### Local Privilege Escalation

This category attempts to turn an already reached account into a more privileged account on the same host.

**What Pentest Copilot may do**

* Run local privilege-escalation techniques on a reached host.
* Start an elevated callback agent if exploitation succeeds.
* Continue post-compromise collection from the elevated context.

**What can remain changed**

* Elevated callback artifacts.
* Temporary exploit files or process artifacts.
* Host logs and security telemetry.

**Cleanup expectations**

* Remove elevated callback artifacts.
* Validate the host state after exploitation.
* Patch or mitigate the local escalation condition.

### Credential Exposure and Reuse

This category uses discovered passwords, hashes, or tickets to prove what access they provide.

**What Pentest Copilot may do**

* Authenticate with discovered passwords, hashes, or Kerberos tickets.
* Crack exposed Kerberos material when roasting paths produce hashes.
* Use credentialed access for remote execution when the target allows it.
* Continue post-compromise collection on newly reached hosts.

**What can remain changed**

* Reusable credential material in assessment artifacts.
* Callback artifacts created by follow-on remote execution.
* Authentication logs across affected services and hosts.

**Cleanup expectations**

* Rotate exposed passwords and hashes.
* Invalidate or expire exposed Kerberos tickets where possible.
* Remove callback artifacts created through follow-on remote execution.

### Domain Trust Abuse

This category abuses trust relationships between Active Directory domains. A successful path can enable cross-domain access.

**What Pentest Copilot may do**

* Extract trust material from a domain.
* Create tickets that cross a domain trust boundary.
* Use trusted-domain access for follow-on actions.

**What can remain changed**

* Trust keys or other trust material exposed in assessment artifacts.
* Reusable Kerberos tickets.
* Cross-domain authentication traces.

**Cleanup expectations**

* Treat extracted trust material as compromised.
* Rotate trust material according to domain recovery procedures.
* Review cross-domain ticket use.

### Golden Ticket Forging

This category uses domain Kerberos signing material to create a forged domain ticket.

**What Pentest Copilot may do**

* Use KRBTGT hash material and the domain SID to forge an administrator ticket.
* Store the forged ticket for pass-the-ticket follow-on actions.

**What can remain changed**

* Reusable forged ticket material.
* Domain-wide Kerberos exposure until the underlying KRBTGT material is rotated.

**Cleanup expectations**

* Rotate KRBTGT according to the organization's domain recovery procedure.
* Review Kerberos logs for forged ticket use.

### Constrained Delegation Abuse

This category abuses constrained delegation configuration to impersonate users to specific services.

**What Pentest Copilot may do**

* Request or extract service tickets for impersonation.
* Use delegated access to act as a privileged user to a target service.
* Store ticket material for follow-on actions.

**What can remain changed**

* Reusable service ticket material in assessment artifacts.
* Authentication traces from impersonated access.

**Cleanup expectations**

* Invalidate exposed tickets where possible.
* Review delegated service account usage.
* Tighten constrained delegation configuration if it is overly broad.

### Unconstrained Delegation Ticket Theft

This category targets hosts configured with unconstrained delegation. Such hosts can hold delegated Kerberos tickets in memory.

**What Pentest Copilot may do**

* Trigger authentication to a delegated host.
* Dump Kerberos tickets from memory on that host.
* Store captured tickets for pass-the-ticket follow-on actions.

**What can remain changed**

* Captured Kerberos ticket material.
* Temporary ticket dump files or archives.
* Authentication traces from coercion and ticket use.

**Cleanup expectations**

* Invalidate exposed tickets where possible.
* Remove temporary ticket dump artifacts from the host.
* Review and reduce unconstrained delegation assignments.

### Lateral Movement

This category uses confirmed access to move from one internal system to another.

**What Pentest Copilot may do**

* Authenticate to additional reachable hosts.
* Run remote execution or database command-execution paths on services with supported execution methods.
* Expand post-compromise collection to newly reached systems.

**What can remain changed**

* Callback agents, temporary payloads, or service changes on reached hosts.
* Authentication and execution logs across multiple systems.
* Reusable credentials or tickets created during the movement path.

**Cleanup expectations**

* Review all reached hosts for callback artifacts.
* Rotate credentials used for movement.
* Validate host compromise state and service changes.

## Sensitive collection paths

These categories are less likely to modify Active Directory objects, but they can collect sensitive data that requires careful handling after the assessment.

### Credential Disclosure

This category collects or cracks credential material that was exposed by another finding.

**What Pentest Copilot may do**

* Crack or parse exposed credential material.
* Store recovered secrets in assessment artifacts.
* Use recovered credentials for follow-on checks if those categories are enabled.

**Cleanup expectations**

* Rotate any recovered credentials.
* Handle exported credential artifacts as sensitive data.

### LAPS Password Access

This category reads local administrator passwords managed through Windows LAPS when directory permissions expose them.

**What Pentest Copilot may do**

* Query directory attributes that expose LAPS-managed local administrator passwords.
* Store recovered local administrator credentials for follow-on checks.

**Cleanup expectations**

* Rotate exposed local administrator passwords.
* Review which users or groups can read LAPS password attributes.

### SMB Share Data Collection

This category reviews accessible Windows file shares for sensitive files.

**What Pentest Copilot may do**

* List files on accessible SMB shares.
* Download selected files to assessment storage.
* Analyze copied files for secrets or sensitive content.

**Cleanup expectations**

* Treat copied files and extracted secrets as sensitive assessment artifacts.
* Remove or archive artifacts according to the engagement data-handling policy.

### FTP and Information Disclosure Collection

This category reviews accessible FTP or similar exposed file services for sensitive files.

**What Pentest Copilot may do**

* Enumerate exposed files or records from reachable services.
* Copy selected content into assessment artifacts for review.

**Cleanup expectations**

* Treat copied data as sensitive assessment output.
* Rotate credentials if collected content exposes secrets.

## How to reduce risk from the UI

In the final configuration review, disable any exploit category that is outside the engagement's approved scope.

For a lower-risk internal run:

* Disable ACL privilege escalation, resource-based constrained delegation, domain controller authentication bypass, and ADCS certificate abuse unless AD or certificate-service writes are approved.
* Disable remote code execution, local privilege escalation, and lateral movement unless host compromise and callback deployment are approved.
* Disable credential, ticket, delegation, and trust-abuse categories unless credential collection, cracking, and reuse are approved.
* Keep discovery and enumeration enabled when you only need network and graph visibility.


# Analysing Scan Results

Use results pages in this order: **Activity**, **Statistics**, **Attack Paths**, **Exploit Graph**, then **Reports**.

## 1. Confirm the Scan Finished

Open **Activity -> Activity**.

Check:

* module status;
* failed or cancelled submodules;
* max runtime cancellations;
* agent disconnects;
* browser session failures;
* target blocking or rate-limit events.

Do this before judging coverage. A partial run can still produce findings, but it should not be treated as complete coverage.

{% content-ref url="/pages/QJ9ahgjtOWQNnN87Ivzs" %}
[Activity](/enterprise/activity)
{% endcontent-ref %}

## 2. Review Statistics

Open:

* **Modules -> External Assessment -> Statistics**, or
* **Modules -> Internal Assessment -> Statistics**, or
* **Modules -> Code Assessment -> Statistics**.

Use Statistics to understand aggregate results:

* total findings;
* severity distribution;
* vulnerability categories;
* affected targets;
* for internal assessments: hosts, services, secrets, and compromise indicators.
* for code assessments: repositories, vulnerable code paths, dependency risk, leaked secrets, and inventory coverage.

{% content-ref url="/pages/TJuUXyT5cbg1xFPAH61r" %}
[Statistics](/enterprise/modules/statistics)
{% endcontent-ref %}

## 3. Triage Attack Paths

Open:

* **Modules -> External Assessment -> Attack Paths**, or
* **Modules -> Internal Assessment -> Attack Paths**, or
* **Modules -> Code Assessment -> Attack Paths**.

Start with Critical and High findings. For each finding:

1. Open the finding detail page.
2. Read the summary, evidence, AI reasoning, remediation, and references.
3. Open the attack path drawer.
4. Confirm the graph chain makes sense.
5. Mark the finding Valid, False Positive, or Duplicate.
6. Retest when your team needs fresh verification.

For code assessments, also review the repository, branch or commit, affected files, and whether a fix can be suggested or opened as a pull request.

{% content-ref url="/pages/Qq4eYhCnXnWRSOdpI5cq" %}
[Attack Paths](/enterprise/modules/attack-paths)
{% endcontent-ref %}

## 4. Inspect the Exploit Graph

Open **Dashboard -> Exploit Graph**.

Use the graph to answer:

* What did discovery find under this root entity?
* Which assets led to the finding?
* Which browser session, trajectory, test case, or internal host was involved?
* For code assessments, which repository, branch or commit, dependency, file, or inventory component was involved?
* Are there related findings on the same path?
* Does the path cross a boundary your team considers out of scope?

{% content-ref url="/pages/SVOgW3WWDsCNP6N3NZ7R" %}
[Exploit Graph](/enterprise/exploit-graph)
{% endcontent-ref %}

## 5. Generate Reports

Open **Reports** after triage is complete.

Before generating:

* resolve obvious false positives;
* mark duplicates;
* confirm report root entity;
* decide whether full output is needed;
* choose severity filters for comprehensive reports.

{% content-ref url="/pages/5R9A4WOfbwrPI78VKDKg" %}
[Reports](/enterprise/reports)
{% endcontent-ref %}

## What Not to Miss

* Authenticated findings should identify the browser session or role used.
* Code assessment findings should identify the repository, branch or commit, and affected file or dependency.
* Code assessment inventory should be reviewed from **Modules -> Code Assessment -> SBOM** before sharing SPDX, CycloneDX, or AI-BOM exports.
* Internal findings may require cleanup or credential rotation even if they are later marked duplicate.
* A clean scan is not proof of no risk if discovery, browser sessions, agents, or submodules failed.
* Scheduled scans should be reviewed against approved scope and browser-session validity.


# Attack Surface

Attack Surface is the inventory view for root targets, discovered entities, agents, and ATT\&CK mapping.

<figure><img src="/files/DVANlOgKqwahJkxkFllk" alt=""><figcaption></figcaption></figure>

## Pages

| Page                | Use for                                                                                  |
| ------------------- | ---------------------------------------------------------------------------------------- |
| **Attack Surface**  | Summary of discovered assets and exposure.                                               |
| **All Entities**    | Search and inspect graph entities across the workspace.                                  |
| **Target Entities** | Manage manual root targets: domains, subnets, and APK files.                             |
| **Agents**          | Check connected execution workers.                                                       |
| **ATT\&CK Matrix**  | Review internal/external activity after findings or actions have MITRE ATT\&CK mappings. |

## During Onboarding

Use this section to confirm:

* root domains and subnets match the approved scope;
* discovered assets are expected;
* agents are connected before scans;
* high-value internal entities are known before enabling active exploit categories;
* out-of-scope entities are removed, denied, or excluded before scans.


# Target Assets

Target assets are root entities used as starting points for discovery and assessment.

<figure><img src="/files/bS9LDmJZQZM1yO55rylJ" alt=""><figcaption></figcaption></figure>

## Supported Manual Root Target Types

The Target Entities page supports manual root-target creation for these entity types:

| Type         | Example         | Used for                                    |
| ------------ | --------------- | ------------------------------------------- |
| **Domain**   | `example.com`   | External discovery and external assessment. |
| **Subnet**   | `10.10.0.0/16`  | Internal discovery and internal assessment. |
| **APK File** | uploaded `.apk` | Mobile application analysis.                |

IP addresses are graph entities discovered during scanning or inventory enrichment. They are not manual root targets on this page.

## External Domains

Add root domains only. Do not add full URLs or paths as root domains.

After adding a domain, check **Settings -> Domains** to confirm it is allowed by your external scope rules.

## Internal Subnets

Internal subnets can be added manually as root targets or discovered from connected agents. Add or select only CIDR ranges approved for the engagement.

## Deleting or Changing Targets

Before deleting a root target, confirm whether reports, schedules, attack paths, or graph data still depend on it. For external scope changes, update **Settings -> Domains** and **Settings -> Trajectories** as well.


# Agents

The Agents page shows execution workers connected to the deployment. An agent is not an AI agent. It is a deployed runtime that receives jobs, executes tools, and reports results.

<figure><img src="/files/Ni9433kOLZlKUfADWwzD" alt=""><figcaption></figcaption></figure>

## Agent Roles

| Role        | Used for                                                                                       | Notes                                                             |
| ----------- | ---------------------------------------------------------------------------------------------- | ----------------------------------------------------------------- |
| **SANDBOX** | External browser work: crawling, browser-session recording, authenticated replay, web testing. | Needs browser dependencies and target network access.             |
| **CLOUD**   | External/cloud-side tasks such as OSINT and non-browser jobs.                                  | Usually managed by the deployment.                                |
| **AGENT**   | Internal discovery and internal assessment from inside your network.                           | Must be deployed where it can route to approved internal subnets. |

## What to Check Before a Scan

* The required role is connected.
* The agent status is healthy.
* Public and private IPs match the expected environment.
* Internal agents show the expected subnets and interfaces.
* Job capacity is sufficient for the scan window.
* The agent host has network access to in-scope targets.

## Common Agent Issues

| Symptom                             | Check                                                                                                            |
| ----------------------------------- | ---------------------------------------------------------------------------------------------------------------- |
| External scan cannot start          | Confirm a SANDBOX runner is connected or managed capacity is available.                                          |
| Browser session recording fails     | Check SANDBOX status, browser access to target, WAF/bot blocking, and residential proxy setting.                 |
| Internal discovery shows no subnets | Check AGENT network interface data and route to your network.                                                    |
| PCE Intercept/Inveigh cannot start  | Confirm the selected AGENT exposes interfaces and at least one interface is selected.                            |
| Internal jobs fail immediately      | Check agent connectivity, endpoint protection allowlisting, outbound control-plane access, and local privileges. |

{% content-ref url="/pages/qJVQdMWQN3SOOKDv02QD" %}
[Download Agent](/enterprise/download-agent)
{% endcontent-ref %}


# Exploit Graph

The Exploit Graph shows entities and relationships discovered during scans. Use it to understand how a finding was reached and what other assets are connected to it.

<figure><img src="/files/Los65uMOT5s2SfNIY9aH" alt=""><figcaption></figcaption></figure>

## What the Graph Contains

* **Root entities** such as domains, subnets, IP addresses, and APK files.
* **Discovered assets** such as web pages, APIs, hosts, services, users, groups, certificates, and cloud resources.
* **Operational entities** such as browser sessions, goals, trajectories, test cases, and test case sets.
* **Vulnerabilities** with severity, CVSS/CWE/CVE metadata, evidence, remediation, and validation state.
* **Relations** showing discovery, execution, containment, use, compromise, or exploit-path links.

## Common Uses

* Find all assets under a root domain or subnet.
* Trace a vulnerability back to the page, API, session, host, or credential that produced it.
* Inspect related nodes before marking a finding false positive or duplicate.
* Confirm whether a path crossed an expected boundary.
* Open a node’s properties for raw evidence and metadata.

## Actions

* **Search** for entities by name, URL, IP, label, or identifier.
* **Click a node** to view properties and connected relationships.
* **Expand a node** to load neighbors.
* **Open attack path drawers** from finding pages for a focused read-only path.
* **Use retest mode** from finding pages when fresh validation is needed.

{% content-ref url="/pages/Qq4eYhCnXnWRSOdpI5cq" %}
[Attack Paths](/enterprise/modules/attack-paths)
{% endcontent-ref %}


# Entities

<figure><img src="/files/HXcyd8iQgCpdISrFH8lF" alt=""><figcaption></figcaption></figure>

Entities represent distinct objects in the attack surface that can be discovered, analyzed, and exploited. Each entity type has specific properties and unique identifiers that allow the system to track and deduplicate findings across different assessment phases.

Pentest Copilot stores scan output as typed entities. The root and analysis entities below are the ones most often inspected during triage:

**Types of Entities**

* **Domain (Root):**&#x52;epresents a DNS domain or subdomain that is part of the target organization's attack surface. It can be either a root domain (e.g., example.com) or a subdomain (e.g., api.example.com).
  * **WebPage:** Represents a specific URL endpoint discovered on a web application. It captures both the structure of URLs (with dynamic parameters) and their raw content for analysis.
* **Subnet (Root):** Represents a network subnet discovered during internal assessment. It defines an IP address range that can contain multiple hosts and is used as a starting point for internal network enumeration.
  * **Host**: Represents an individual computer, server, or device discovered within a network subnet during internal assessment.
* **APKFile (Root)**: Represents an Android application package file that can be analyzed for security vulnerabilities
  * **Activity**: Represents an Android application screen or activity discovered through APK analysis. In Android development, an Activity is a single screen with a user interface, and each APK can contain multiple activities that define the app's functionality and user interaction flows.
* **Trajectory**: Represents a sequence of interactions (actions) that achieve a specific goal on a web application or mobile app. It's used for automated testing and vulnerability discovery by recording and replaying user behaviors. \[Found in external assessments for both Android and Web scans]
  * APIAction: Represents HTTP API calls made during the trajectory
  * BrowserAction: Represents browser-based user interactions eg. clicking a button, filling a form
  * AndroidAction: Represents mobile app interactions e.g. Click, swipe, type, scroll

## Frequently Referenced Entity Types

This table is not the full graph schema. It lists the entity types most often needed when reading results, reports, and attack paths.

<table><thead><tr><th width="180">Entity</th><th>Description</th></tr></thead><tbody><tr><td>Activity</td><td>Android app screen (activity) tied to APK analysis and navigation flows.</td></tr><tr><td>ADOBJ</td><td>Generic Active Directory object with DN/GUID, privileges, and ACEs for attack-path mapping.</td></tr><tr><td>AnonymousLogin</td><td>Credential pair representing anonymous or guest access where it was accepted.</td></tr><tr><td>APKFile</td><td>Android package (APK) used as the root target for mobile analysis.</td></tr><tr><td>Application</td><td>Logical application asset in attack-surface modeling (distinct app identity in ASM).</td></tr><tr><td>ASN</td><td>Autonomous System Number associated with discovered network infrastructure.</td></tr><tr><td>BrowserSession</td><td>Captured browser state: cookies, storage, auth metadata, and recorded browser actions.</td></tr><tr><td>Certificate</td><td>TLS/X.509 material: CN, SANs, validity, and related serving endpoints.</td></tr><tr><td>CertificateAuthority</td><td>Enterprise AD CS certificate authority configuration (web enrollment, permissions, exposure).</td></tr><tr><td>CertificateTemplate</td><td>AD CS certificate template definition (EKUs, enrollment flags, and misconfiguration context).</td></tr><tr><td>CloudResource</td><td>Exposed cloud endpoint or object (URL, access level, provider, scan metadata).</td></tr><tr><td>Delegation</td><td>Kerberos delegation relationship or finding (constrained/unconstrained style trust abuse surface).</td></tr><tr><td>Device</td><td>External asset or host fingerprint: OS, addresses, hostname, CPE, and discovery context.</td></tr><tr><td>Disk</td><td>Storage volume or mount surfaced during internal assessment for further file-level inspection.</td></tr><tr><td>Domain</td><td>DNS domain or subdomain: scope anchor with optional paths, DX/DNS metadata, and crawl settings.</td></tr><tr><td>DomainEscalation</td><td>Cross-domain or trust abuse scenario (trust direction/type, success, affected domains).</td></tr><tr><td>Employee</td><td>Person record from OSINT (name, role, contact, location, linked socials).</td></tr><tr><td>File</td><td>File artifact (path/type/content or URL-flag) tracked with a deduplication key.</td></tr><tr><td>Generic</td><td>Catch-all node wrapping a single scalar <code>value</code> when no specialized type applies.</td></tr><tr><td>GithubAccount</td><td>GitHub profile/account node for social/OSINT correlation.</td></tr><tr><td>Goal</td><td>High-level testing goal for crawling/automation (domain, APK, session, or parent linkage).</td></tr><tr><td>GraphQLSchema</td><td>Introspected GraphQL schema tied to a web URL for API security testing.</td></tr><tr><td>Group</td><td>Security group (membership, tiering, privileges, ACL/control edges) in the internal model.</td></tr><tr><td>GPO</td><td>Group Policy Object (paths, affected objects, control/abuse-relevant metadata).</td></tr><tr><td>Host</td><td>Internal assessment host: hostname/IP, OS, DC flags, delegation, and compromise state.</td></tr><tr><td>InternalSubnet</td><td>Subnet or network segment used in external/ASM-style internal network modeling.</td></tr><tr><td>IPAddress</td><td>Single IP asset with liveness, ports, services, CPE, and sighting timestamps.</td></tr><tr><td>IPRange</td><td>CIDR or ranged network block with geo/hosting/asn context (lightweight non-Entity helper type in code).</td></tr><tr><td>LinkedinAccount</td><td>LinkedIn profile/account node for OSINT.</td></tr><tr><td>MailServer</td><td>MX host record (address and priority) for a domain’s mail infrastructure.</td></tr><tr><td>MediumAccount</td><td>Medium profile/account node for OSINT.</td></tr><tr><td>Memory</td><td>Short- or long-term agent memory blob linked to a parent entity for context retention.</td></tr><tr><td>NetworkHost</td><td>Network-visible host abstraction in ASM (host-level discovery complementing IP/Device).</td></tr><tr><td>PasswordFiles</td><td>Recovered credential material from files (username, hash, cracked password when available).</td></tr><tr><td>Secret</td><td>Normalized credential or sensitive artifact (identifiers + typed secrets + metadata).</td></tr><tr><td>Service</td><td>Network service on an IP (name, port, protocol, banner) driving follow-on checks.</td></tr><tr><td>ServiceName</td><td>Kerberos service principal / SPN-style record with delegation-related attributes.</td></tr><tr><td>Session</td><td>Interactive session identifier with user binding and active/inactive state.</td></tr><tr><td>S3Bucket</td><td>Object storage bucket with permissions, ownership, and enumeration summary.</td></tr><tr><td>SMB</td><td>SMB relationship or SMB-oriented finding distinct from a named share (<code>SMBShare</code>).</td></tr><tr><td>SMBShare</td><td>Discovered SMB share name with assessed access level.</td></tr><tr><td>SocialAccount</td><td>Platform-agnostic social profile (username, URL, stats, verification, enrichments).</td></tr><tr><td>Subnet</td><td>Internal engagement subnet (CIDR/name/gateway/DHCP context) for host discovery.</td></tr><tr><td>Technology</td><td>Stack or product fingerprint (e.g. framework/CMS) on an asset.</td></tr><tr><td>TestCase</td><td>Structured security test definition (ideas, indicators, CWE, severity, execution traces).</td></tr><tr><td>TestCaseSet</td><td>Batch container of test cases with category and optional downstream tester dispatch.</td></tr><tr><td>TGS</td><td>Kerberos service ticket (TGS) material with SPN, user, and expiry metadata.</td></tr><tr><td>TGT</td><td>Kerberos Ticket-Granting Ticket for a user/realm with expiry and encrypted payload.</td></tr><tr><td>Trajectory</td><td>Ordered list of actions (browser/API/mobile) summarizing a user flow for replay and deduped testing.</td></tr><tr><td>TwitterAccount</td><td>Twitter/X profile/account node for OSINT.</td></tr><tr><td>User</td><td>Domain or internal user with sam/name, membership, session/privilege edges, and compromise flag.</td></tr><tr><td>Vulnerability</td><td>Reported finding with target, CWE/CVE, CVSS, narrative, references, and verification state.</td></tr><tr><td>WebApplication</td><td>Web app surface (URL, title, tech, behaviors) grouping pages and behaviors.</td></tr><tr><td>WebPage</td><td>Concrete URL (dynamic-parameter pattern, content, screenshots) as the unit of web testing.</td></tr><tr><td>WebPageGroup</td><td>Deduplicated cluster of related <code>WebPage</code> records processed as a single batch.</td></tr><tr><td>WhoisData</td><td>Registrar/WHOIS fields for a domain (lifecycle, registrant hints, name servers, status).</td></tr><tr><td>Wordlist</td><td>Wordlist file path used for cracking or spraying workflows.</td></tr></tbody></table>


# Relations

Relations are directed edges between graph entities. They show how one entity was discovered from another, how entities are structurally connected, or how an attack path moved through the environment.

## How to Read a Relation

A relation records one of these facts:

* How was this entity discovered?
* What does this entity belong to?
* Which asset runs this service?
* Which browser session, role, or identity was used?
* Which test case set produced this vulnerability?
* Which internal object can control or compromise another object?

Example:

```
Domain -> BrowserSession -> WebPage -> Goal -> Trajectory -> TestCaseSet -> Vulnerability
```

This chain means the vulnerability was found by testing a trajectory generated from a page under the domain, inside a specific browser session.

Each **BrowserSession** represents one recorded role or identity, such as an unauthenticated visitor, a standard user, or an admin. Pages, goals, trajectories, and test case sets are grouped under that session so the graph can distinguish what was reachable or testable from each identity.

**TestCaseSet** is the main testing node in this path. It contains the generated test cases for a category or trajectory. Individual **TestCase** details may appear in deeper finding or debugging views, but the high-level relation should be read through the TestCaseSet rather than as a separate normal hop for every graph path.

## Relation Metadata

Some relations include module or submodule references. These are useful for support and debugging because they connect graph output back to Activity, logs, and LLM traces.

## Triage Tips

* A vulnerability without a plausible incoming path should be reviewed carefully.
* A duplicate finding should link back to the original finding or share the same affected path.
* Internal relations involving credentials, tickets, AD objects, or delegation should be reviewed before cleanup decisions.


# Modules

Modules are the pages where operators configure and run discovery, assessment, and result-review workflows.

## External Assessment

| Page                | Use for                                                                         |
| ------------------- | ------------------------------------------------------------------------------- |
| **Discovery Phase** | Map domains, web pages, APIs, services, and trajectories before active testing. |
| **Attack Phase**    | Run external vulnerability testing against selected targets.                    |
| **Statistics**      | Review aggregate external results.                                              |
| **Attack Paths**    | Triage external findings and retest.                                            |

## Internal Assessment

| Page                | Use for                                                                       |
| ------------------- | ----------------------------------------------------------------------------- |
| **Discovery Phase** | Discover internal hosts and services through a connected local agent.         |
| **Attack Phase**    | Run internal assessment on selected subnets with per-subnet exploit controls. |
| **Statistics**      | Review aggregate internal results.                                            |
| **Attack Paths**    | Triage internal findings and retest.                                          |

## Code Assessment

| Page             | Use for                                                                                                          |
| ---------------- | ---------------------------------------------------------------------------------------------------------------- |
| **Repositories** | Select GitHub repositories, run manual assessments, schedule assessments, and open per-repository scan settings. |
| **Statistics**   | Review aggregate code assessment findings by severity, category, repository, and trend.                          |
| **Attack Paths** | Triage confirmed source-code, dependency, secret, authorization, and business-logic findings.                    |
| **SBOM**         | Review AI-BOM and SBOM verification, then download SPDX, CycloneDX, and AI-BOM exports.                          |

## Other Module Areas

The sidebar can include credential-compromise modules, custom modules, and test/debug modules when those features are enabled for the tenant. Use those only when they are part of the approved engagement.

## Before Running Any Module

Check:

* target scope is approved;
* required agents are connected, or the GitHub App is connected for code assessment;
* scan configuration is saved;
* branch or commit selection is intentional for code assessment;
* estimates and runtime warnings are acceptable;
* schedules are created from the final run review and reference the intended saved settings;
* destructive internal categories are approved.

Existing schedules are reviewed and deleted from **Activity -> Schedule**.


# Statistics

The **Statistics** page provides a high-level overview of vulnerabilities and findings for a given assessment scope. It can be viewed **per assessment** or **per root entity** (Domain, Subnet, Repository, or APK file) to help prioritize remediation efforts.

* **Views** – Separate dashboards are available for **External Assessments**, **Internal Assessments**, and **Code Assessments**, each tailored to the nature of the test.
* **Metrics shown:**
  * Total vulnerabilities and severity breakdown
  * Percentages of vulnerabilities by severity. External assessments follow the active severity display mode: CVSS uses Critical, High, Medium, Low, or Informational, while VRT uses Bugcrowd-style P1-P5 priorities when VRT data is available.
  * Most common CWE IDs and vulnerability types
  * Top vulnerabilities by CVSS score
  * Vulnerabilities grouped by affected asset or relation
  * Time-based trends of vulnerability discovery
  * For internal assessments: discovered subnets, hosts, services, ports/protocols, and secrets found
  * For code assessments: repository findings, code issue categories, dependency risk, leaked secrets, and inventory coverage

<figure><img src="/files/n5bnH6duRC4uSFQU1Oz9" alt=""><figcaption></figcaption></figure>

Set the external severity mode from **Settings -> External -> Severity Display**.

Choose **CVSS** for standards-aligned risk and compliance views. Choose **VRT** for bug bounty style prioritization using Bugcrowd's web and API taxonomy. See [Bugcrowd VRT](https://bugcrowd.com/vulnerability-rating-taxonomy).

This page acts as the **central reporting view** for assessment results, helping security teams understand exposure, identify recurring weaknesses, and track progress over time.


# Attack Paths

The Attack Paths page is the triage surface for every vulnerability discovered in a module. Each row is a single finding with its full attack chain attached, from the entry point to the exploited node

It is available under:

* `Modules → External Assessment → Attack Paths`
* `Modules → Internal Assessment → Attack Paths`
* `Modules → Code Assessment → Attack Paths`

<figure><img src="/files/JtJT9wQ5cyVpGniQaESs" alt=""><figcaption></figcaption></figure>

### Findings list

The list groups findings into three triage tabs. Each tab shows a live count for the currently applied filters.

| Tab                 | Meaning                                                                                      |
| ------------------- | -------------------------------------------------------------------------------------------- |
| **Valid**           | Confirmed findings that need attention. Default tab.                                         |
| **False Positives** | Findings the Validator (or a reviewer) marked as not exploitable.                            |
| **Duplicates**      | Findings that re-state an already-reported issue. Each duplicate links back to its original. |

A `N findings total` indicator on the right shows the combined count across all three tabs for the current filter set.

#### Filters

The filter bar above the tabs scopes every tab simultaneously.

* **Search**: free-text match against vulnerability name (debounced).
* **Domain** *(external)* / **Subnet** *(internal)* / **Repository** *(code assessment)*: multi-select. You must pick at least one target before findings load.
* **Type**: vulnerability category (XSS, SSRF, Auth Bypass, etc.).
* **Severity**: filters by the active severity display mode. CVSS mode uses Critical, High, Medium, Low, or Informational. VRT mode uses Bugcrowd-style P1-P5 priorities for external assessment findings.
* **Sort**: `Critical first` or `Informational first`.

Selected domains and subnets persist across navigations within the session.

External assessment severity display is controlled from **Settings -> External -> Severity Display**. Choose **CVSS** when you need standards-aligned severity data for compliance and remediation tracking. Choose **VRT** when your team wants bug bounty style triage against Bugcrowd's web/app Vulnerability Rating Taxonomy. See [Bugcrowd VRT](https://bugcrowd.com/vulnerability-rating-taxonomy).

#### Row layout

Each row shows: severity pill, vulnerability name, type, target host/path, and discovery date. Clicking a row opens the **Finding detail** page for that vulnerability.

***

### Finding detail page

<figure><img src="/files/ryOUOgKb1lNWzJek8Jtl" alt=""><figcaption></figcaption></figure>

Selecting a finding opens a dedicated report page at:

```
/app/modules/{external-assessment|internal-assessment|code-assessment}/attack-paths/{vuln_id}
```

This page is a full vulnerability report, designed to be read top-to-bottom, exported, or shared. The right-hand sidebar holds properties, actions, and a jump-to navigator.

#### Header

* Breadcrumb back to the findings list
* Vulnerability name (with target host appended)
* Severity pill, CWE, published date, and a `Verified` badge if the Validator confirmed the finding. External findings follow the active CVSS/VRT display mode.

#### Duplicate banner

If the finding is a duplicate, a banner at the top names the original it duplicates (clickable) and shows the LLM-generated reason for the duplicate match.

#### Sections

1. **Summary**: Markdown-rendered vulnerability description.
2. **Details**: severity data, CVSS score, CVE ID, CWE, type, target, and discovery date. External findings can show CVSS severity and VRT priority when VRT data is available.
3. **AI Reasoning**: a staged timeline of how the Copilot arrived at this finding:
4. **Remediation**: suggested fix, rendered from Markdown.
5. **References**: auto-linked CVE (NVD), CWE (MITRE), and any external reference URLs.
6. **Attack Path**: opens the full graph drawer (see below).

#### Sidebar

* **Properties**: severity, CVSS, CVE, CWE, type, target, date, verified status.
* **Status pill**: change the finding between `Valid`, `False Positive`, and `Duplicate`. Requires the `vulnerabilities.update_status` permission.
* **View Attack Path**: opens the graph drawer in read-only mode.
* **Retest**: opens the graph drawer in retest mode. Requires the `scans.retest` permission.
* **Jump to**: quick links to every section of the report. When indicator hits exist, a highlighted shortcut group lists each hit modification individually. The sidebar can be collapsed with the chevron in its top bar.

***

### Attack path drawer

<figure><img src="/files/Cl0RDYMw1R3DGxlJWK9R" alt=""><figcaption></figcaption></figure>

The drawer renders the full chain of nodes for the finding

#### View mode

Read-only graph for inspecting the chain. Useful for understanding *how* the Copilot reached the vulnerability.

#### Retest mode

Toggle **Retest mode** in the drawer to:

1. Pick a **start node** anywhere in the chain. The retest will replay every step from that node onward.
2. *(Internal assessments)* select the agent that should run the retest.
3. *(External assessments)* optionally pin a browser session.
4. *(Code assessments)* confirm the repository and branch or commit context before retesting.
5. Click **Start retest** to enqueue. Retest results flow back into the same finding and update its verification status. The button is disabled if your role lacks `scans.retest`.

<figure><img src="/files/6mf39FzJchU4DovDVuH5" alt=""><figcaption></figcaption></figure>

***

### Status workflow

| Status             | When to use it                                                                                                                |
| ------------------ | ----------------------------------------------------------------------------------------------------------------------------- |
| **Valid**          | Default for new Copilot-confirmed findings.                                                                                   |
| **False Positive** | Mark when manual review shows the vulnerability isn't exploitable. Moves the finding to the False Positives tab.              |
| **Duplicate**      | Use when the finding repeats one already reported. Pair with the duplicate metadata so the report links back to the original. |

Status changes are written immediately and reflected on the list (counts and tab membership update) without a page reload.


# Activity

Activity is the operational view for scans and scheduled work. Use it while a scan is running and when investigating what happened after a scan finishes.

<figure><img src="/files/a6zgKwbFVJa68ix7gT8H" alt=""><figcaption></figcaption></figure>

## Activity Page

Open **Activity -> Activity**.

Use this page to check:

* module type, such as External Attack Phase, Internal Attack Phase, External Discovery Phase, Internal Discovery Phase, Calibration Phase, Retesting, or Pre-Flight Test;
* module status;
* start and end time;
* root target;
* progress through submodules;
* failure or cancellation state.

Click a module row to open the activity detail page for that module.

## Activity Detail

The detail page is the first place to inspect a scan that is slow, failed, cancelled, or producing unexpected results.

Check:

* which submodules ran;
* which submodules are pending, running, completed, failed, or cancelled;
* when each stage started and ended;
* whether failures are isolated or repeated;
* whether a max runtime limit cancelled remaining work.

## Attack Logs

Open **Activity -> Attack Logs** for lower-level event logs.

Use logs when the module-level view is not enough, for example:

* agent disconnected;
* browser session failed;
* target blocked scanner traffic;
* rate-limit calibration failed;
* submodule timed out;
* RabbitMQ or worker pickup was delayed;
* internal agent could not reach a host or subnet.

{% content-ref url="/pages/a9GP0W0haHX5Y0rHbGoi" %}
[Logging](/enterprise/activity/logging)
{% endcontent-ref %}

## Schedules

Open **Activity -> Schedule** to view and delete one-time or recurring schedules.

{% content-ref url="/pages/LLoc9R3DJqOcKInTTM8W" %}
[Scheduling](/enterprise/activity/scheduling)
{% endcontent-ref %}


# Logging

Logs record scan and system events that are useful for troubleshooting. They are separate from final findings: a scan can produce useful logs even when it produces no vulnerabilities.

## When to Use Attack Logs

Use **Activity -> Attack Logs** when:

* a module or submodule failed;
* a scan is stuck or slower than expected;
* a browser session stopped working;
* a target blocked or rate-limited requests;
* an internal agent disconnected;
* an internal host or service was unreachable;
* a scheduled run did not start;
* you need scan evidence for review or escalation.

## What to Look For

| Symptom                | Log evidence to check                                                                         |
| ---------------------- | --------------------------------------------------------------------------------------------- |
| Browser session failed | validation errors, replay failures, expired auth, missing storage, verification URL mismatch. |
| Target blocked scanner | HTTP 403/429 patterns, WAF pages, captcha loops, rate-limit calibration failures.             |
| Internal agent issue   | disconnects, heartbeat gaps, job pickup failures, route or interface errors.                  |
| Module timeout         | max runtime cancellation, submodule timeout, long-running job status.                         |
| Queue delay            | scheduled/running state with delayed worker pickup.                                           |

## Filtering

Filter logs by time range, module, severity, and text search. Start with the module reference from **Activity -> Activity**, then narrow to the failing time window.


# Scheduling

Schedules start discovery or assessment modules later or on a recurring cadence. Create schedules from the same run flow used to launch the module immediately, so the schedule captures the selected targets, module settings, saved scan configuration, agent assignment, and safety controls for that run.

## Create a Schedule

From a discovery or assessment module page:

1. Select targets or subnets.
2. Configure settings, including authentication, rate limits, exploit controls, exclusions, agent assignment, and other run-specific options.
3. Save the scan configuration when the page requires it.
4. Open the final run review by clicking the run action, such as **Run Discovery** or **Run Assessment**.
5. In the review drawer, choose **Schedule** instead of starting immediately.
6. Choose:
   * **Doesn't repeat** and a future run time; or
   * **Repeats** with an interval and unit.
7. Confirm the schedule.

The schedule modal supports interval units of minutes, hours, and days.

{% hint style="info" %}
Scheduling is part of the run review. Do not create a schedule from a separate empty scheduler form, because the scheduler needs the same payload and module configuration that would be used for an immediate run.
{% endhint %}

## Manage Schedules

Open **Activity -> Schedule**.

Use this page to:

* switch between one-time and recurring schedules;
* filter by schedule status;
* open schedule details, including the saved payload and scan configuration reference;
* delete schedules.

The Activity schedule page is for reviewing and managing schedules. Start new schedules from the relevant module's run flow.

## Important Behavior

Schedules use the payload and saved scan configuration created when the schedule is submitted. If you later change browser sessions, rate limits, allowed exploits, trajectory scope, target scope, responder/PCE Intercept settings, exclusions, or agent assignment, review whether the schedule must be recreated.

Recurring schedules reuse the stored run payload each time they fire. Confirm that the selected agents, credentials, browser sessions, and target scope will still be valid for each future run window.

## Before Scheduling Production Scans

Confirm:

* the scan window is approved;
* the required agents are expected to be online;
* browser sessions will still be valid;
* rate limits match the target's production capacity;
* internal exploit families are approved for the scheduled window;
* reports and on-call contacts are planned for high-impact runs.


# Reports

Use **Reports** to generate and download PDF reports from graph data and findings.

<figure><img src="/files/IXfGBaGawEKgHuvjqFQh" alt=""><figcaption></figcaption></figure>

## Report Types

The Reports page exposes two report types:

| Report type              | UI value    | Use for                                                                |
| ------------------------ | ----------- | ---------------------------------------------------------------------- |
| **Comprehensive Report** | `general`   | Technical assessment detail for security teams and remediation owners. |
| **Executive Report**     | `executive` | Summary-level reporting for leadership and risk owners.                |

## Supported Root Entities

Reports can be generated for these root entity types:

* **Domain**
* **IP Address**
* **Subnet**

The entity picker searches existing graph entities of the selected type.

## Generate a Report

1. Open **Reports**.
2. Click **Generate Report**.
3. Select **Comprehensive Report** or **Executive Report**.
4. Select the root entity type.
5. Search for and select the root entity.
6. Choose report options.
7. Click **Generate Report**.

Generation runs asynchronously. The report table shows an in-progress row with progress and current step. When generation completes, the row is replaced by the completed report.

## Report Options

### Full Output

By default, request/response and job output are truncated for readability.

Enable **Full Output** when your team needs complete raw evidence. Full-output reports can be large and slower to generate, open, and share.

### Severity Filter

For **Comprehensive Report**, choose which severities appear in finding detail:

* Critical
* High
* Medium
* Low
* Info

Selecting all severities or none sends no severity filter and includes all severities.

### Debug Report Version

The **Debug Report Version** field appears only for users with debug access. Leave it blank unless you need to regenerate a specific report version.

## Report Table

The table shows:

* report name or entity name;
* report type;
* entity type;
* output options, such as truncated or full output;
* generation time;
* download action.

Use search to find reports by report ID, filename, root entity ID, entity name, report type, or entity type.

## Before Sharing

Check:

* finding statuses are correct;
* duplicates and false positives have been triaged;
* the selected root entity matches the approved scope;
* full output does not expose secrets or unnecessary internal data;
* internal findings that changed state have cleanup notes available.


# Vulnerability Testing Coverage

Vulnerability categories covered by external and internal assessment.

This page lists the vulnerability categories you can expect to see in Pentest Copilot findings and scan configuration.

External Assessment uses these category IDs:

```
AUTHENTICATION
OPEN_REDIRECT
AUTHORIZATION
BUSINESS_LOGIC
CACHE
COMMAND_INJECTION
CSRF
DIRECTORY_TRAVERSAL
FILE_UPLOAD
IDOR
INFORMATION_DISCLOSURE
JWT
MASS_ASSIGNMENT
NOSQL_INJECTION
OAUTH
PROMPT_INJECTION
PROMPT_LEAKAGE
PROTOTYPE_POLLUTION
REQUEST_SMUGGLING
SAML
SERIALIZATION
SQL_INJECTION
SSTI
SSRF
WEBSOCKETS
XML
XSS
```

Internal Assessment categories depend on the exploit and check families enabled for the tenant. The groups below cover Active Directory, host, credential, delegation, ADCS, lateral movement, data exposure, and RCE paths.

### External Assessment Vulnerabilities

#### Authentication & Authorization

**Authentication**

Weak authentication mechanisms that permit unauthorized access, from issues such as weak password policies, misconfigured authentication flows, inadequate session management, flawed token-based systems (e.g., JWT), or SQL Injection Auth bypasses.

**Authorization**

Improper access control can lead to privilege escalation and data breaches. Common flaws include IDOR (Insecure Direct Object References) and broken role-based access control (RBAC).

**IDOR (Insecure Direct Object References)**

Occurs when a user can access unauthorized resources by modifying object identifiers (e.g., changing user\_id=123 to user\_id=124 in a request to access another user's data).

**JWT (JSON Web Tokens)**

Weak signing algorithms, lack of expiration checks, and improper key handling can lead to token forgery and authentication bypass.

**OAuth**

Poorly implemented OAuth flows can lead to token leakage, unauthorized access, and account takeover (e.g., open redirect exploits).

**SAML**

XML signature attacks, misconfigured assertions, or token manipulation can lead to authentication bypass and identity theft.

#### Injection Vulnerabilities

**SQL Injection**

Injection of malicious SQL queries into application inputs to manipulate or extract data from a relational database, potentially enabling unauthorized data access, or modification.

**NoSQL Injection**

Manipulating NoSQL queries via unvalidated user input, often in MongoDB, to bypass authentication or extract sensitive data.

**Command Injection**

Executing user-supplied commands within a system shell due to improper input validation, leading to full system compromise.

**SSTI (Server-Side Template Injection)**

Injecting malicious template syntax (e.g., Embedded Ruby (ERB), Jinja) to execute arbitrary code on the server.

**XML (XXE)**

Poorly secured XML processing can lead to XML External Entity (XXE) attacks, which may expose internal files or perform SSRF.

#### Client-Side & Browser Vulnerabilities

**XSS (Cross-Site Scripting)**

Be able to inject HTML or JavaScript into the application to execute malicious scripts in the user's browser potentially stealing cookies or performing unauthorized actions.

**CSRF (Cross-Site Request Forgery)**

Tricks authenticated users into performing unintended actions (e.g., transferring funds) by exploiting a lack of request origin validation.

**Open Redirect**

Open redirect vulnerabilities occur when a web application or server uses unvalidated, user-supplied input to redirect users to other sites. This can allow attackers to craft malicious links that appear legitimate but redirect to malicious sites.

**Prototype Pollution**

Altering JavaScript object prototypes through user input, leading to unexpected behavior, privilege escalation, or XSS attacks.

#### File & Directory Vulnerabilities

**File Upload**

Improper validation of file uploads can lead to remote code execution (RCE) or unauthorized file access, especially when allowing executable file types.

**Directory Traversal**

Allows attackers to access files outside the intended directories by manipulating file paths (e.g., ../../../etc/passwd).

#### Server-Side Vulnerabilities

**SSRF (Server-Side Request Forgery)**

Exploiting a vulnerable server to make unauthorized requests to internal systems, often leading to data exposure or further exploitation.

**Serialization**

Deserializing untrusted data without proper validation can allow attackers to execute arbitrary code or manipulate object states.

**HTTP Request Smuggling**

Manipulating HTTP headers to send malformed requests that bypass security controls, leading to request hijacking or data leakage.

#### Application Logic & Configuration

**Business Logic**

Exploiting flaws in the application's logic (e.g., bypassing price validation in an e-commerce site) can lead to financial loss or abuse of system functionality.

**Mass Assignment**

A mass assignment attack is a security vulnerability that occurs when a web application automatically assigns user-supplied input values to properties or variables of a program object. This can become an issue if a user is able to modify attributes they should not have access to, like a user's permissions or an admin flag.

**Race Condition**

Exploiting concurrency flaws to perform unauthorized actions (e.g., withdrawing money twice by submitting multiple requests rapidly).

**Cache**

Caching sensitive data (e.g., session tokens) in shared or public storage can lead to unauthorized access. Improper cache control headers can expose private data.

#### Information Disclosure

**Information Disclosure**

Unintended exposure of sensitive data via error messages, misconfigured servers, or leaked credentials in source code.

#### Protocol & Communication Vulnerabilities

**WebSockets**

Lack of authentication and validation in WebSocket communications can lead to unauthorized data access or injection attacks.

***

### Internal Assessment Vulnerabilities

#### Active Directory & Authentication

**Authentication Bypass**

Bypassing authentication mechanisms in Active Directory or network services to gain unauthorized access.

**Credential Exposure**

Exposure of credentials through insecure storage, transmission, or configuration that could lead to unauthorized access.

**Credential Disclosure**

Unauthorized disclosure of credentials through various attack vectors including memory dumps, configuration files, or network interception.

#### Privilege Escalation

**Privilege Escalation**

Gaining elevated privileges beyond what is normally granted, allowing access to restricted resources or administrative functions.

**ACL Privilege Escalation**

Exploiting misconfigured Access Control Lists (ACLs) in Active Directory to escalate privileges and gain unauthorized access to sensitive objects.

#### Active Directory Delegation Vulnerabilities

**Unconstrained Delegation**

Misconfigured Kerberos delegation allowing service accounts to impersonate users to any service, potentially leading to domain compromise.

**Constrained Delegation**

Exploiting constrained delegation configurations to impersonate users to specific services, enabling lateral movement and privilege escalation.

**RBCD (Resource-Based Constrained Delegation)**

Abusing resource-based constrained delegation to gain unauthorized access to services by modifying delegation settings on target objects.

**RBCD Configured**

Detection of configured resource-based constrained delegation that could be exploited for privilege escalation attacks.

#### Active Directory Certificate Services (ADCS)

**ADCS Template Vulnerabilities (ESC1-ESC15)**

Various ADCS certificate template vulnerabilities that allow impersonation of domain administrators through certificate abuse, including:

* ESC1: Direct certificate request for domain admin UPN
* ESC2/ESC3: Certificate request with on-behalf-of functionality
* ESC4: Template modification vulnerabilities
* ESC5: Admin access to CA server
* ESC6: EDITF\_ATTRIBUTESUBJECTALTNAME2 enabled
* ESC7: Dangerous CA permissions
* ESC8: Web enrollment over HTTP with relay attack
* ESC9: No security extension vulnerabilities
* ESC10: Weak cert mapping
* ESC11: Encryption not enforced
* ESC13-ESC15: Various policy and schema vulnerabilities

#### Kerberos & Ticket Vulnerabilities

**Golden Ticket Vulnerability**

Detection of conditions allowing creation of Golden Tickets (forged Kerberos TGTs) to maintain persistent access to the domain.

#### Active Directory Trust Vulnerabilities

**AD Bidirectional Trust**

Misconfigured bidirectional trust relationships between domains that could allow unauthorized cross-domain access.

#### Lateral Movement

**Lateral Movement**

Techniques used to move through a network after initial compromise, accessing additional systems and resources.

#### Remote Code Execution

**Remote Code Execution**

Ability to execute arbitrary code on remote systems, often through vulnerable services or misconfigurations.

#### Configuration & Information Disclosure

**Configuration Weakness**

Security misconfigurations in systems, services, or applications that create vulnerabilities or expose sensitive information.

**Information Disclosure**

Unintended exposure of sensitive information through error messages, misconfigured services, or insecure protocols.

#### Share & Access Vulnerabilities

**Share Exposure**

Insecure SMB share configurations exposing sensitive files or directories to unauthorized access.

**LAPS Password Abuse**

Abuse of Local Administrator Password Solution (LAPS) configurations or vulnerabilities to obtain administrative credentials.


# Settings

Configure tenant, scan, access, agent, integration, and scope settings.

Settings contains the controls that affect scan eligibility, scan behavior, access, integrations, and scope. Review these pages before your first scan.

<figure><img src="/files/QyIrVUgkbsPNP6VToILl" alt=""><figcaption></figcaption></figure>

## Usage

Open **Settings -> Usage** to check scan entitlement and current consumption.

Use this page to verify:

* available credits or scan-hour allowance;
* running and queued scan counts;
* plan or billing state;
* feature availability, such as internal assessment, scheduled scans, API/MCP access, reports, and attack paths;
* whether scan launch is blocked by missing domain setup, usage limits, feature access, or agent availability.

Credits are counted as worker runtime. Parallel workers may finish faster, but credit usage reflects the combined runtime of the workers.

## External

Open **Settings -> External** to set tenant-wide defaults for external scans. The page title is **External Assessment**.

Tenant-wide external controls include:

* severity display mode for external assessment findings;
* default attack vectors;
* custom headers;
* max module runtime, in seconds.

Severity display mode controls whether external assessment dashboards, finding lists, filters, and charts show the CVSS severity band or the Bugcrowd Vulnerability Rating Taxonomy priority.

* **CVSS** shows standards-aligned severity data derived from CVSS scoring. Choose it for compliance reporting, general remediation tracking, and teams that already triage by Critical/High/Medium/Low.
* **VRT** shows Bugcrowd-style P1-P5 priority data for web and API findings. Choose it when you want bug bounty style prioritization that maps findings to a shared web/app vulnerability taxonomy.

Learn more about Bugcrowd VRT: <https://bugcrowd.com/vulnerability-rating-taxonomy>

Rate limits, browser sessions, starting paths, trajectory scope, and browser behavior are configured per target from the External Discovery Phase or External Attack Phase settings drawer. Per-target settings can override tenant defaults for a specific run.

{% content-ref url="/pages/JqTFyGv6qHEq1MBlbEzs" %}
[Configure Scan Settings for External Assessment](/enterprise/how-to-trigger-an-external-scan/configure-scan-settings-for-external-assessment)
{% endcontent-ref %}

## Internal Assessment Settings

Internal assessment settings are configured in the launch flow, not from a separate Settings sidebar page.

Per-subnet controls such as allowed exploits, entity exclusions, agent assignment, PCE Intercept/Inveigh, RCE skip behavior, and runtime warnings are configured from **Modules -> Internal Assessment -> Attack Phase**.

## Domains

Open **Settings -> Domains** to manage external scope.

* **Whitelist** defines domains approved for external work.
* **Blacklist** blocks domains even if they are discovered through an approved root.

Blacklist takes precedence over whitelist.

{% content-ref url="/pages/0ajjGH6BFpdgg11q6axz" %}
[Domains](/enterprise/settings/domains)
{% endcontent-ref %}

## Domain Verification

Open **Settings -> Domain Verification** to prove DNS ownership of root domains before gated external workflows.

{% content-ref url="/pages/KbaSIgSbMUURkiHIWkMl" %}
[Domain Verification](/enterprise/settings/domain-verification)
{% endcontent-ref %}

## Trajectories

Open **Settings -> Trajectories** to create host/path rules for discovered API and browser flows.

Use these rules when your team wants to include or exclude specific endpoint paths across runs.

{% content-ref url="/pages/M0MfkR8EXMrAeSyOno1b" %}
[Trajectories](/enterprise/settings/trajectories)
{% endcontent-ref %}

## Agent

Open **Settings -> Agent** to download agent installers, view connection details, and manage agent runtime settings.

Use it to confirm:

* agent role, such as SANDBOX, CLOUD, or AGENT;
* connection status;
* public and private IPs;
* subnets and network interfaces;
* job-capacity settings when the agent exposes them.

{% content-ref url="/pages/qJVQdMWQN3SOOKDv02QD" %}
[Download Agent](/enterprise/download-agent)
{% endcontent-ref %}

## API Keys

Open **Settings -> API Keys + MCP** to create, rotate, or revoke API keys for REST and MCP clients.

API keys inherit the permissions and workspace/organization scope of the creating user. They cannot bypass scan launch policy.

{% content-ref url="/pages/630pgqCxCXa6IGmOxWjz" %}
[API Keys & MCP Server](/enterprise/settings/api-keys-and-mcp-server)
{% endcontent-ref %}

## Integrations

Open **Settings -> Integrations** to connect supported external systems. Availability depends on the deployment and feature flags.

Integration surfaces are tenant-gated. Connectors shown as **Coming soon** are visible in the UI but not active for the tenant.

## Email Identities

Open **Settings -> Email Identities** when browser-session recording needs controlled email addresses for OTPs, magic links, or account creation flows.

Plan email/phone routing during onboarding if target applications only allow approved domains or phone numbers.

## Users and Account

Use **Settings -> Users** and **Settings -> Account** to manage team access and account details. Confirm role assignments before giving users scan, report, API-key, or settings permissions.

## Debug and Preflight

Some deployments expose **Settings -> Debug** and **Settings -> Preflight Test**. Use these pages when you need deeper validation of scan readiness or runtime behavior.

Use preflight checks before high-stakes scans to validate queue health, job concurrency, connectivity, and crawler behavior.


# API Keys & MCP Server

Pentest Copilot API keys let external tools call the REST API and the platform MCP server

<figure><img src="/files/RZJEtpZjJOlaRyDFnhMw" alt=""><figcaption></figcaption></figure>

### Create an API Key

You need permission to manage API keys in your workspace or organization.

1. Open **Settings -> API Keys + MCP** in Pentest Copilot.
2. Select **Create API key**.
3. Enter a name that identifies the integration, such as `Claude Desktop`, `Cursor`, or `CI pipeline`.
4. Copy the raw key when it is shown.

The raw key is only shown once when you create or rotate it. If the key is lost or exposed, rotate it from the same page.

API keys are scoped to your workspace or organization. A key inherits the permissions of the user that created it, so MCP tools and REST endpoints enforce the same access controls as the web app.

### REST API Usage

Send API keys to REST endpoints with the `X-API-Key` header.

```bash
curl \
  -H "X-API-Key: <your-api-key>" \
  https://<your-pentest-copilot-host>/api/auth/me
```

The OpenAPI schema is available at:

```
https://<your-pentest-copilot-host>/api/docs
```

### MCP Server Usage

Use the MCP endpoint for external MCP clients:

```
https://<your-pentest-copilot-host>/mcp
```

Most MCP clients should send the key as a bearer token:

```json
{
  "mcpServers": {
    "pentest-copilot": {
      "url": "https://<your-pentest-copilot-host>/mcp",
      "headers": {
        "Authorization": "Bearer <your-api-key>"
      }
    }
  }
}
```

The MCP server also accepts `X-API-Key: <your-api-key>`, but the bearer-token form is the recommended MCP client configuration.

### Available MCP Workflows

The exact tools shown to a client depend on the API key's permissions and enabled product features. Common MCP workflows include:

* Asset management: `list_assets`, `get_asset`, `create_root_target`, `delete_root_target`
* Graph exploration: `search_graph`, `get_graph_node`, `get_graph_root_nodes`
* Scan orchestration: `start_external_discovery`, `start_external_assessment`, `start_internal_discovery`, `start_internal_assessment`
* Scan job control: `get_jobs`, `cancel_submodule`, `rerun_submodule`
* Settings and reporting: `get_settings`, `update_settings`, `generate_report`, `list_reports`
* Logs and stats: `get_attack_logs`, `get_module_stats`

### Scan Launch Requirements

API keys and MCP clients cannot bypass scan launch policy. Starting discovery or assessment through MCP is subject to the same checks as starting a scan in the web app:

* The workspace or organization must have scan usage available.
* Plan, payment, and credit restrictions still apply.
* The API key must be scoped to an active workspace or organization.
* External scans require the requested domain to be in the workspace or organization scope.
* Internal scans require the internal assessment feature and a connected agent.
* The requested target must belong to the API key's workspace or organization.

If any of these checks fail, the MCP tool returns an error instead of starting the scan.

### Rotate or Revoke Keys

Rotate a key when it is exposed, when a user leaves, or when an integration owner changes.

Revoke keys that are no longer used. Revocation takes effect immediately for both REST API calls and MCP calls.

### Troubleshooting

`401 Missing API key` : The MCP or REST request did not include an API key.

`401 Invalid API key` : The key is incorrect, revoked, or belongs to a workspace that no longer matches the request.

`403 API key is not bound to a workspace; please re-create it.` : The key is missing workspace scope. Create a new key from **Settings -> API Keys + MCP**.

`403` role or feature errors : The key's permissions or plan do not allow the requested tool.

Payment, credit, usage, or scope errors : The scan was blocked by the same launch requirements enforced in the web app. Confirm the domain is in scope and the workspace has scan usage available.

Agent availability errors : Internal scans require a connected agent. External scans may be temporarily unavailable if required scanning capacity is unavailable.

### Security Best Practices

* Use one API key per MCP client or integration.
* Store keys in a secrets manager or the MCP client's secure configuration.
* Do not commit keys to source control, tickets, chat, or documentation.
* Rotate keys regularly and immediately after exposure.
* Revoke old keys instead of reusing them across tools.
* Treat MCP clients as privileged automation. Depending on the key's role, a client can start scans, modify targets, cancel submodules, generate reports, and read attack data.


# Domains

Use **Settings -> Domains** to manage external domain scope.

<figure><img src="/files/JJjPcAuVnFWirr21HPlM" alt=""><figcaption></figcaption></figure>

## Whitelist

The whitelist is the allow-list for external discovery and assessment. Add domains that are approved for testing.

Examples:

```
example.com
*.example.com
*.dev.example.com
```

Use the whitelist to keep discovered related domains inside approved scope.

Domain scope controls which domains are allowed. Domain ownership verification is handled separately in **Settings -> Domain Verification**.

{% content-ref url="/pages/KbaSIgSbMUURkiHIWkMl" %}
[Domain Verification](/enterprise/settings/domain-verification)
{% endcontent-ref %}

## Blacklist

The blacklist blocks domains even if they would otherwise be included by discovery or whitelist rules.

Examples:

```
analytics.example.com
*.third-party.example
payments-vendor.com
```

Use the blacklist for:

* third-party services;
* production areas excluded from the engagement;
* domains owned by partners or vendors;
* targets that must not receive automated traffic.

## Rule Precedence

Blacklist takes precedence over whitelist.

If `*.example.com` is whitelisted and `billing.example.com` is blacklisted, `billing.example.com` is excluded.

## Before a Scan

Confirm:

* every intended root domain is listed;
* excluded third-party domains are blacklisted;
* wildcard rules do not accidentally include unrelated assets;
* scheduled scans still match the current domain policy.


# Domain Verification

Verify root-domain ownership before external recording and scanning.

Use **Settings -> Domain Verification** to prove ownership of root domains before running external discovery, external attack phases, browser-session recording, or Manual Crawler flows when verification is required.

The guided **New Assessment** flow also includes a **Verify Domain** step for the same check.

## Verification Flow

1. Open **Settings -> Domain Verification**.
2. Select the root domain that needs verification.
3. Publish the DNS TXT record shown in the challenge.
4. Click **Verify Now**.
5. Wait for the status to change to **Verified**.

If the DNS challenge expires or needs to be regenerated, use **Refresh Challenge** and publish the new TXT value before trying again.

## Statuses

| Status         | Meaning                                                                                |
| -------------- | -------------------------------------------------------------------------------------- |
| **Verified**   | The domain passed ownership verification and can be used for gated external workflows. |
| **Pending**    | A challenge exists, but the TXT record has not been confirmed yet.                     |
| **Unverified** | No valid ownership proof has been completed for the root domain.                       |

## When Verification Blocks Work

Verification may be required before:

* recording browser sessions;
* using Manual Crawler;
* launching external discovery;
* launching external attack phases.

If a flow is blocked, open **Settings -> Domain Verification**, verify the root domain, then return to the scan or browser-session flow.

Enterprise managers can disable verification enforcement for some deployments. Shared trial environments usually require DNS TXT verification unless Bugbase support grants an exception.


# Trajectories

Add Trajectory Whitelist and Blacklist

The Trajectory Whitelist and Blacklist feature gives you precise control over which API endpoints are included or excluded during external security assessments. This allows you to define the exact scope of automated testing, ensuring that scans focus only on relevant API endpoints.

### Key Features

* **Per-host rules** — Rules are applied independently for each host or domain.
* **Regex pattern matching** — Use regular expressions to match path patterns.
* **Blacklist takes precedence** — Any path matching a blacklist rule is always excluded, even if it also matches a whitelist rule.

### Trajectory Whitelist

The whitelist defines which API paths are **allowed** to be tested for a given host. Only endpoints whose paths match the whitelist regex pattern will be included in the external assessment.

Use the whitelist when you want to restrict testing to specific, known API areas.

<figure><img src="/files/pWGprqqJMIPBKvJsa5xZ" alt=""><figcaption></figcaption></figure>

### Trajectory Blacklist

The blacklist defines which API paths must be **excluded** from testing. Any endpoint whose path matches a blacklist regex pattern will be completely ignored during the assessment, regardless of whether it matches a whitelist rule.

**Important**: Blacklist rules always override whitelist rules.

<figure><img src="/files/jR9ZwDJrmj6yOgIQisQL" alt=""><figcaption></figcaption></figure>

### How to Configure Rules

1. Open **Settings -> Trajectories**.
2. **Under the Trajectory Whitelist Section, choose a host**:
   * Select an existing discovered host from the list, or
   * Choose **Select** **Custom Host** and enter the hostname manually.
3. **Add a rule**:
   * Enter a valid regex pattern for the path.
   * Click **Add rule**.
4. Repeat the process to add multiple rules for the same host or a different host.

You can add rules to both the **Trajectory Whitelist** and **Trajectory Blacklist** sections independently.

### Common Regex Pattern Examples

Here are useful patterns to get you started:

```
api/users — Matches the exact path /api/users
/api/users/.* — Matches /api/users/ followed by anything (e.g., /api/users/123)
^/api/v[0-9]+/.* — Matches versioned API paths like /api/v1/, /api/v2/, etc.
^/api/(users|posts|comments)/.* — Matches specific resources: /api/users/…, /api/posts/…, or /api/comments/…
^/admin/.* — Matches all admin-related paths (useful for blacklisting)
^/(api|graphql)/.* — Matches both REST API and GraphQL endpoints
.*\.(js|css|png|jpg|gif)$ — Matches static asset files (recommended for blacklisting)
```

### Testing Your Rules (Examples Section)

Before launching an external assessment, always verify your whitelist and blacklist configuration using the **Examples** testing area on the right side of the page.

**How to test**:

1. Select a host from the dropdown.
2. View the list of currently discovered API endpoints.
3. Each endpoint will show whether it **passes** (included) or **fails** (excluded) based on your rules.
4. You can also enter custom paths to test them instantly.

{% hint style="info" %}
This step is crucial because the entire API testing scope depends on the correct whitelist and blacklist behaviour. Testing here helps catch misconfigured regex patterns early and prevents unintended inclusion or exclusion of endpoints.
{% endhint %}

<figure><img src="/files/f8926FojkhJPf0CQ7iXu" alt=""><figcaption></figcaption></figure>


# Helpful Copilot

Copilot is the in-app assistant for operating the dashboard and interpreting scan output.

<figure><img src="/files/kcvo8cTCDa12XKOyufGn" alt="" width="193"><figcaption></figcaption></figure>

## Good Uses

Ask Copilot to:

* summarize a finding or attack path;
* explain why a finding matters;
* draft a remediation plan from a finding detail page;
* identify which scan settings apply to a target;
* help navigate to Activity, Reports, Settings, or a module page;
* explain graph nodes and relationships.

## Limits

Copilot does not replace operator approval. Before acting on its suggestions:

* confirm target scope;
* verify finding evidence;
* check destructive-action warnings;
* confirm the user has permission to run the suggested action;
* review generated commands or remediation text before sharing outside your team.

## Example Prompts

* `Summarize the attack path for this finding in executive-safe language.`
* `What evidence proves this is exploitable?`
* `What should the remediation owner fix first?`
* `Which browser session or role was used for this finding?`
* `What scan settings could reduce traffic against this production target?`


# Download Agent

Use **Settings -> Agent** to generate a short-lived deployment launcher for an internal assessment host.

The launcher downloads the agent package, enrolls it with the control plane, and starts the agent. Generate it when the assessment host is ready.

## Supported Platforms

* Windows
* Linux
* macOS Apple Silicon
* macOS Intel

## Before Generating a Launcher

Confirm:

* written authorization and approved subnet scope;
* the host is inside the target network or has a route to it;
* endpoint protection and EDR allow the BugBase PCE Agent package, install directory, state directory, and process;
* outbound HTTPS is allowed from the host to the RTCS URL and package download host;
* the host can initiate assessment traffic to approved internal targets;
* the operator has local administrator/root privileges where required.

## Generate and Run

1. Open **Settings -> Agent**.
2. Select the target platform.
3. Click **Generate Launcher**.
4. Copy or download the launcher.
5. Run it from an administrator/root shell on the assessment host.
6. Watch **Settings -> Agent** or **Dashboard -> Agents** until the agent appears connected.
7. Start internal discovery only after the agent is connected and reports the expected network information.

## Runtime Paths

The UI shows expected install, state, log, temp/download, and process paths for the selected platform. Use those paths for EDR/AV allowlisting and cleanup planning.

For Windows, the page also shows example Microsoft Defender commands for allowlisting the install path, state path, process, and self-signed code-signing certificate.

## Bootstrap Token

The page exposes an admin bootstrap/master callback token for enrollment workflows. Treat it as sensitive.

Rotate it when:

* it was copied into the wrong place;
* an operator leaves the engagement;
* a launcher or token was exposed;
* your security policy requires token rotation.

Rotating the token invalidates the current bootstrap token. Existing enrolled agents are not affected.

## After the Engagement

Plan cleanup before the scan:

* stop and remove the agent where it is not needed for recurring assessments;
* remove temporary files and logs according to your retention policy;
* remove temporary EDR/AV allowlisting if it was engagement-specific;
* rotate exposed credentials or tokens if they were copied outside approved storage.


# User Guide

Pentest Copilot - Your ultimate ethical hacking assistant, copilot utilizes context to give directed results. From analysing web apps to root shells, it’s got you

{% hint style="info" %}
Pentest Copilot (Open Source) is a fundamentally different offering from our Enterprise edition. The open-source version is designed primarily for research purposes, operating as a human-in-the-loop system capable of running basic CTF-style attacks. In contrast, Pentest Copilot Enterprise is a fully autonomous, agentic system deeply integrated into web, Android, and Active Directory workflows.
{% endhint %}

Pentest Copilot (Consumer) has been open-sourced and is fully available at [https://github.com/bugbasesecurity/pentest-copilot](https://github.com/bugbasesecurity/pentest-copilot?utm_source=chatgpt.com).

The detailed wiki has been moved to [https://github.com/bugbasesecurity/pentest-copilot/wiki](https://github.com/bugbasesecurity/pentest-copilot/wiki?utm_source=chatgpt.com) — use it to locally deploy and try out Pentest Copilot. And don’t forget to ⭐ us!